


11
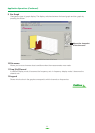
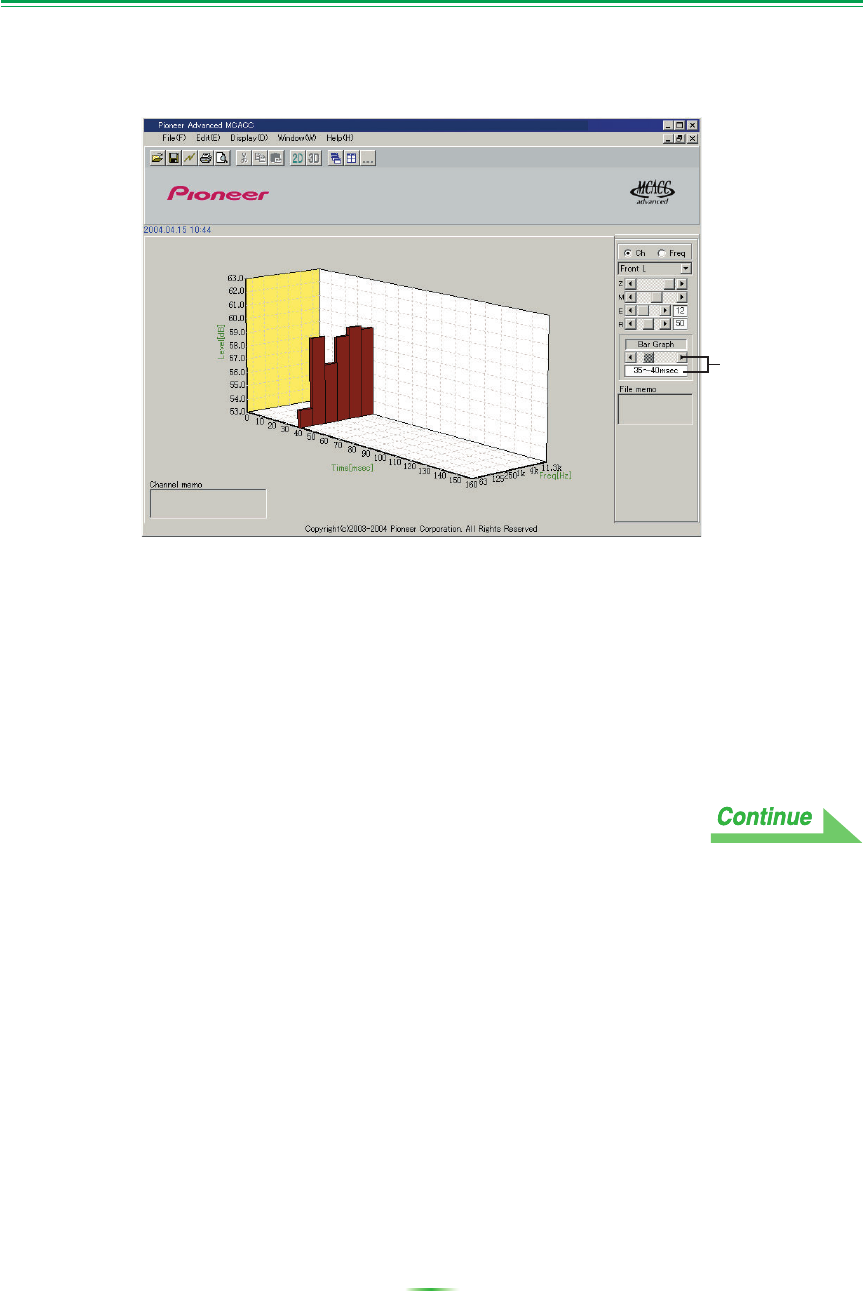
9 Bar Graph
Changes the type of graph display. The display switches between the band graph and bar graph by
pressing this button.
10 File memo
Allows you to record memos about conditions when the measurements were made.
11 Freq [Hz]/Channel
In channel display mode, it becomes the frequency axis. In frequency display mode, it becomes the
channel axis.
12 Legend
Shows which colors in the graphs correspond to which channels or frequencies.
Moves the viewpoint
of the time axis.
Application Operations (Continued)