


P
AL
NTSC
Picture
Quality
Re
s
olution
T
o
t
al
Frame
Rate
C
a
p
ability
Re
s
olution
T
o
t
al
Frame
Rate
C
a
p
abili
t
y
Best
720*
5
76
25F/S
3.80G
720*
4
80
30F/S
3.75G
High
720*
5
76
25F/S
1.91G
720*
4
80
30F/S
2.34G
Norm
al
720*
5
76
25F/S
0.96G
720*
4
80
30F/S
1.20G
Low
720*
5
76
25F/S
0.83G
720*
4
80
30F/S
0.80G
Best
720*
2
88
50F/S
4.10G
720*
2
40
60F/S
3.94G
High
720*
2
88
50F/S
2.60G
720*
2
40
60F/S
2.42G
Normal
720*
2
88
50F/S
1.28G
720*
2
40
60F/S
1.40G
Low
720*
2
88
50F/S
0.98G
720
*
2
40
60F/S
0.83G
Best
360*
2
88
100F/S
3.42G
360*
2
40
120F/S
3.62G
High
360*
2
88
100F/S
2.25G
360*
2
40
120F/S
2.27G
Normal
360*
2
88
100F/S
1.21G
360*
2
40
120F/S
1.25G
Low
360*
2
88
100F/S
1.05G
360*
2
40
120F/S
0.98G
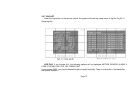
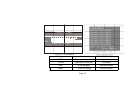
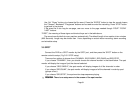
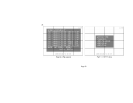
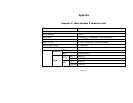
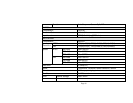
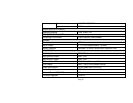
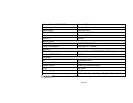
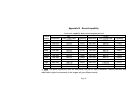
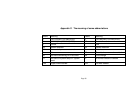
Appendix B Record capability
--how much capability does record engross per hour
Note: The above figures are from our tests which are just for user’s reference. Different definition and
stabilization (object’s movement) of the images will give different results.
Page 87