


MEPS − Televisions April 2005
Page 22
A study produced for the Energy Efficiency and Conservation Authority by
Wise Analysis Ltd
from the Australia New Zealand Trade Ministers' Meeting in 2003 stated that: “To this end, we
are committed to ensuring that the Arrangement is supported by the continued development of
joint Australian and New Zealand standards. We recognise the importance of joint standards to
our business communities.”
There are no specific dispute resolution procedures. The close and long-standing political
relationship between Australia and New Zealand means that any issues of grievance or concern
are addressed through discussion between the two governments. The effect of the TTMRA is
that if Australia has a MEPS regime, whilst New Zealand does not, theoretically it would be
possible to import non-compliant TVs to Australia on the grounds that the equivalent set was
acceptable for sale in New Zealand. In practice the selling margin between the two grades of
set, would not be sufficient to offset the loss of marketing edge of such a move. Thus the
dangers are more apparent than real.
9.3 Greenhouse Gas Reduction Potential
Avoided power costs are usually considered to save energy at marginal generation costs, which
are thermal, and thus emit CO
2
. The methodology is demonstrated in some detail in Meridian’s
Te Āpiti design document
15
which shows a CO
2
emission factor for thermal generation rising
from of 572 g CO
2
/kWh in 2005, to 698 g CO
2
/kWh in 2025. The average over this 20 year
period is 635 g CO
2
/kWh.
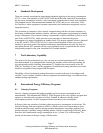
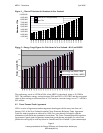
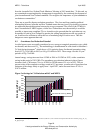
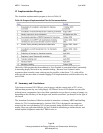
Annual energy savings increase from 8 GWh in 2006 to 29 GWh in 2025, with a cumulative
saving in this period of 392 GWh. The greenhouse gas reduction inherent in these figures
increases from 4,700 tonnes CO
2
-e/yr in 2006 to 20,000 tonnes CO
2
-e/yr in 2025. The net
present value of the cumulative savings costed at $15 per tonne, a conservative figure based on
estimates of the charge likely to apply from 1 April 2007, and a discount factor of 10% is
$10.78 million.
Figure 3 − Savings in CO
2
Emissions − BAU and MEPS.
0.00
0.05
0.10
0.15
0.20
0.25
0.30
0.35
0.40
0.45
0.50
2004
2006
2008
2010
2012
2014
2016
2018
2020
2022
2024
Emissions (MT-e/yr
CO2)
Emissions MT CO2-e/yr (BAU)
Emissions MT CO2-e/yr (MEPS)
15
Te Āpiti Wind Farm Project: Project Design Document (ERUPT 3) www.senter.nl/sites/erupt/contents/i001413/ meridian_energy_eru _03_
06_pdd_final.pdf