


Chapter 1 19
Making Basic Measurements
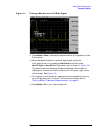
Resolving Small Signals Hidden by Large Signals
Resolving Signals Example:
Resolve two input signals with a frequency separation of 155 kHz and
an amplitude separation of 60 dB.
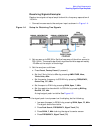
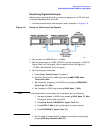
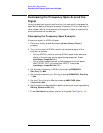
1. Connect two sources to the analyzer input as shown in Figure 1-9.
Figure 1-9 Setup for Obtaining Two Signals
2. Set one source to 300 MHz at −10 dBm.
3. Set the second source to 300.155 MHz, so that the signal is 155 kHz
higher than the first signal. Set the amplitude of the signal to
−70 dBm (60 dB below the first signal).
4. Set the analyzer as follows:
a. Press Preset, Factory Preset (if present).
b. Set the Y-Axis Units to dBm by pressing AMPLITUDE, More,
Y-Axis Units,
dBm.
c. Set the center frequency to 300 MHz by pressing FREQUENCY,
Center Freq, 300, MHz.
d. Set the span to 2 MHz by pressing SPAN, Span, 2, MHz.
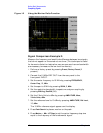
NOTE If the signal peak is not present on the display, do the following:
1. Increase the span to 20 MHz by pressing SPAN, Span, 20, MHz.
The signal should now be visible.
2. Press Peak Search, FREQUENCY, Signal Track (On)
3. Press SPAN, 2, MHz to bring the signal to center screen.
4. Press FREQUENCY, Signal Track (Off)
e. Set the resolution bandwidth to spectrum analyzer coupling by
pressing BW/Avg, Resolution BW (SA).