


44 Chapter 1
Making Basic Measurements
Identifying Distortion Products
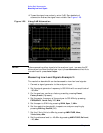
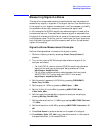
12.To determine whether the harmonic distortion products are
generated by the analyzer, first save the screen data in trace 2 as
follows:
a. Press Trace/View, Trace (2), then Clear Write.
b. Allow the trace to update (two sweeps) and press Trace/View, View,
Marker, Delta. The analyzer display shows the stored data in trace
2 and the measured data in trace 1.
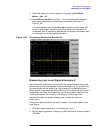
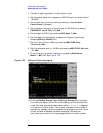
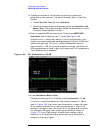
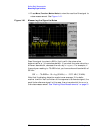
13.Next, increase the RF attenuation by 10 dB: press AMPLITUDE,
Attenuation, and the step-up key (↑) twice. See Figure 1-36.
Notice the ∆Mkr1 amplitude reading. This is the difference in the
distortion product amplitude readings between 0 dB and 10 dB input
attenuation settings. If the ∆Mkr1 amplitude absolute value is
approximately ≥1 dB for an input attenuator change, the distortion
is being generated, at least in part, by the analyzer. In this case more
input attenuation is necessary.
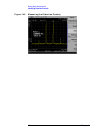
Figure 1-36 RF Attenuation of 10 dB
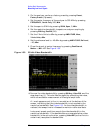
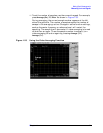
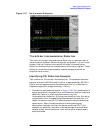
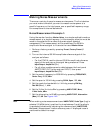
14.Press Peak Search, Marker, Delta
Change the attenuation to 15 dB by pressing Attenuation, 15, dB.
If the ∆Mkr1 amplitude absolute value is approximately ≥1dB as
seen in Figure 1-36, then more input attenuation is required; some
of the measured distortion is internally generated. If there is no
change in the signal level, the distortion is not generated internally.
For example, the signal that is causing the distortion shown in
Figure 1-37 is not high enough in amplitude to cause internal
distortion in the analyzer so any distortion that is displayed is
present on the input signal.