


Chapter 2 81
Making Complex Measurements
Making Stimulus Response Measurements
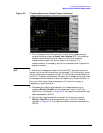
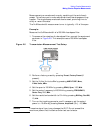
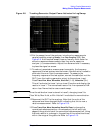
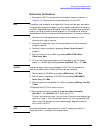
Figure 2-9 Tracking Generator Output Power Activated in Log Sweep
10.Put the sweep time of the analyzer into stimulus response auto
coupled mode by pressing
Sweep, then Swp Coupling (SR). See
Figure 2-9. Auto coupled sweep times are usually much faster for
stimulus response measurements than they are for spectrum
analyzer (SA) measurements. Adjust the reference level if necessary
to place the signal on screen.
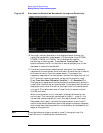
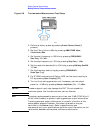
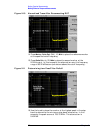
11.To make a transmission measurement accurately, the frequency
response of the test system must be known. Normalization is used to
eliminate this error from the measurement. To measure the
frequency response of the test system, connect the cable (but not the
DUT) from the tracking generator output to the analyzer input.
Press
Trace/View, More, Normalize, Store Ref (1→3), Normalize (On).
This will activate the trace 1 minus trace 3 function and display the
results in trace 1. The normalized trace or flat line represents 0 dB
return loss. Normalization occurs each sweep.
NOTE Since the calibration trace is stored in trace 3, changing trace 3 to
Clear Write, Max Hold, or Min Hold will invalidate the normalization.
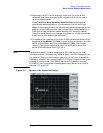
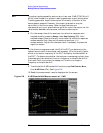
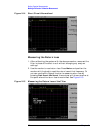
12.Reconnect the DUT to the analyzer. Note that the units of the
reference level have changed to dB, indicating that this is now a
relative measurement. Refer to Figure 2-10.
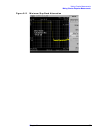
13.Press
Trace/View, More, Normalize, Norm Ref Posn to change the
normalized reference position. Arrowheads at the left and right
edges of the graticule mark the normalized reference position. Using
the knob results in a change in the position of the normalized trace,
within the range of the graticule. Refer to Figure 2-10.