Monitoring System Activity and Performance 152-402-145-02, Issue 2
12 June 16, 2000 H2TU-R-402
USING THE PERFORMANCE SCREENS TO VIEW PERFORMANCE DATA
To access the Performance history screens:
1 Press to select the Performance screen.
2 Press the to select either interface (H2TU-C DS1, H2TU-R DS1, H2TU-C HDSL2, or H2TU-R
HDSL2), then press .
3 Press the to select the type of statistics (Current, Alarm History, 25 Hour History, 48 Hour
History, or 31 Day History), then press .
Performance History at the DS1 Interface
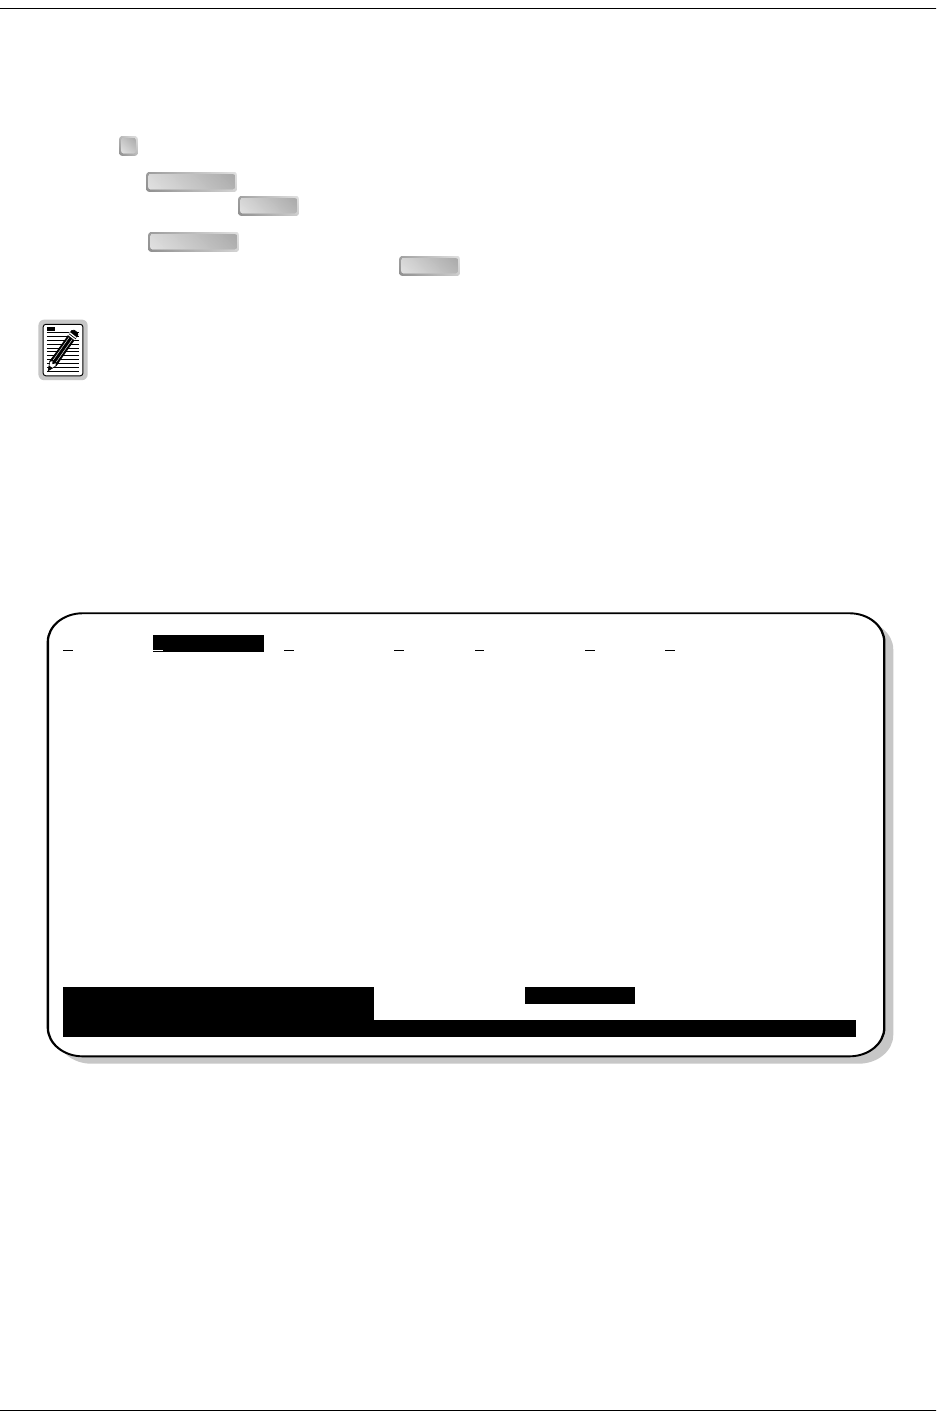
Figure 5 is an example of a 31-Day History screen for the H2TU-R DS1 interface. The DS1 interface provides
31-day, 48-hour, 25-hour, and current statistics screens for the H2TU-R and the H2TU-C. Table 5 on page 16
describes the kinds of errors reported for these screens.
Figure 5. H2TU-R DS1 31-day Performance History
Performance screens for the H2TU-C are shown only when they are different from the H2TU-R
screens.
P
SPACEBAR
ENTER
SPACEBAR
ENTER
Monitor Performance Event Log Config Inventory Rlogon Help
H2TU-R DS-1 31 Day History (Page 1 of 3)
------------------------------------------------------------------------------
Date ES-L SES-L UAS-L CV-L PDVS-L ES-P SES-P UAS-P PRM-NE PRM-FE
04/03 ----------
04/04 ----------
04/05 ----------
04/06 ----------
04/07 ----------
04/08 ----------
04/09 ----------
04/10 ----------
04/11 ----------
04/12 ----------
04/13 ----------
04/141410101210100000
04/15 0002000000
Press: (N)ext Page, (P)revious Page, C(l)ear History
------------------------------------------------------------------------------
Press <Space> to cycle through Interface : H2TU-R DS-1
choices and <Enter> to view Statistics : 31 Day History
ID: xxxx--xxxx--xxxx--xxxx 04/15/00 12:30:01 H2TU-R System: OK
