


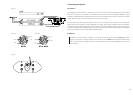
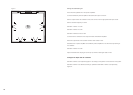


Place the microphone at the chosen measurement position that is
closest to the speaker under test (where it will measure the highest
sound pressure level). Set the “Input Ch.1” slider to maximum.
Set the “Output” slider to zero and switch on the test signal by
clicking the button. Increase the output level until the “Input
Ch.1” level meter just goes into the red zone. Decrease the “Input
CH.1” level until the signal peaks between the -6dB and -3dB
marks.
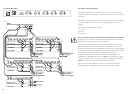
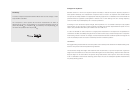
Close the “Volume and Input Levels” window and click the
button to switch off the test signal.
Make sure Plot…Overlay is checked to show the frequency response screen and enable several responses to be
viewed simultaneously.
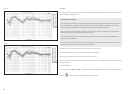
Press the F7 key to bring up the Measurement Settings window. In the ‘‘Levels’’ box, set the sine sweep to -40dB
FS (full scale).
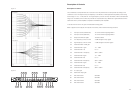
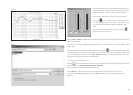
Perform a number of measurements in different positions by clicking the button (or pressing the F2 key). Make
the last measurement you take close to the centre of the listening area and leave the microphone exactly in that
position for subsequent measurements. Since Plot…Overlay is checked, the curves will be plotted on top of each
other and, when finished, there will be n curves displayed.
In the example shown in figure 22, n = 10.
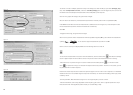
Click the button to display the mean value on top of all the plotted curves. The average room response is then
calculated (figure 23). This is the response we want to equalise.
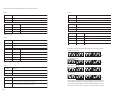
Un-tick all the plots except the mean response. (figure 24)
Press CTRL+ E to save this mean result in the “Tune EQ” folder (if this folder doesn’t exist, create it in
C:\Program Files\WinMLS2004\Set EQ). Then click Save and name the file, for example, Average_resp.txt
(figure 25)
Figure 24
Figure 25
23