


Highs and Lows Mode
31
Weather Data Highs and Lows
Viewing Highs and Lows
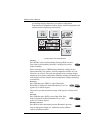
1. Press HI/LOW to enter the Highs and Lows mode.
The DAY and HIGHS icons light up and the station displays the highs
for all visible fields.
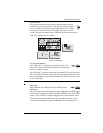
2. Press the up and down arrows to scroll between Day Highs, Day Lows,
Month Highs, Month Lows, Year Highs and Year Lows.
The HIGH or LOW icon, as well the DAY, MONTH or YEAR icon
lights to display which High/Low screen you’ve selected.
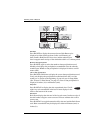
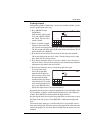
3. Press the left and right arrows to scroll back and forth through the last
24 values.
Pressing the left arrow displays the previous day’s highs. Each time you
press the left arrow, the date moves back another day. The 24 dots in the
graph field also represent each of the last 24 days, months, or years; the
right-most dot is the present day. As you move backward and forward
the flashing dot changes to show what value you’re looking at.
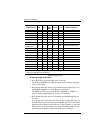
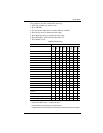
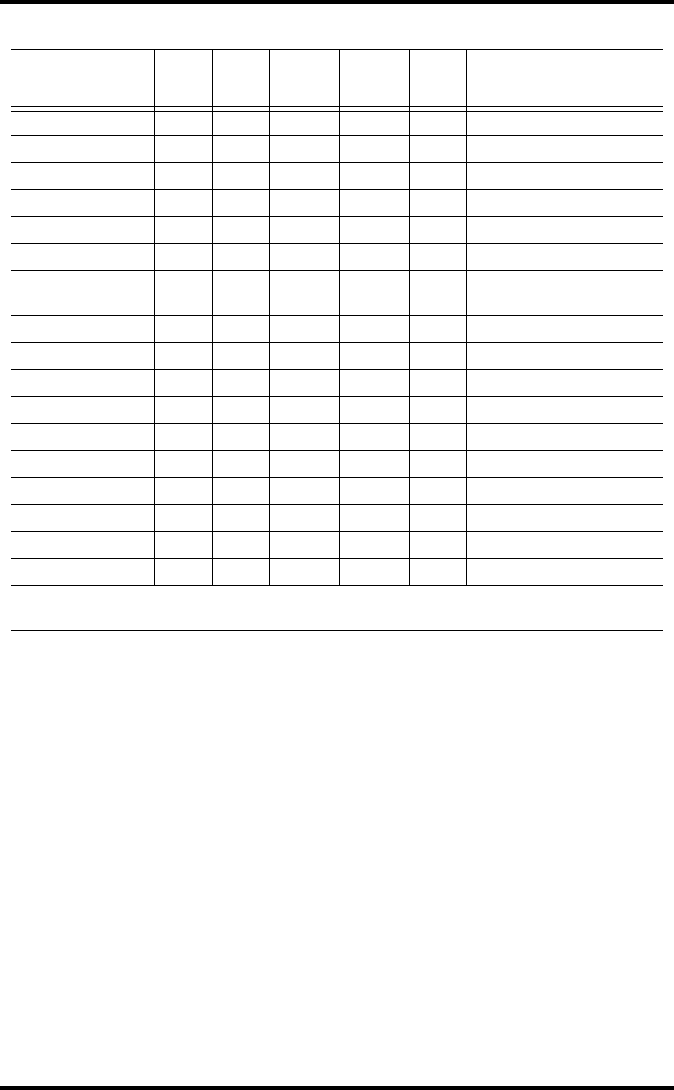
Weather Variable High Low
Day,
Time &
Date
Month Year Additional Information
Outside Temperature Yes Yes Yes Yes Yes
Inside Temperature Yes Yes Yes Yes Yes*
Outside Humidity Yes Yes Yes Yes Yes*
Inside Humidity Yes Yes Yes Yes Yes*
Barometer Yes Yes Yes Yes Yes*
Heat Index Yes Yes Yes Yes*
Temp/Hum/Wind/Sun
(THSW) Index
Yes Yes Yes Yes* requires solar radiation sensor
Wind Chill Yes Yes Yes Yes*
Wind Speed Yes Yes Yes Yes Includes direction
Rainfall Rate Yes Yes Yes Yes
Daily Rain Total Total Total
UV Index Yes Yes Yes** Yes* requires UV sensor
Solar Radiation Yes Yes Yes** Yes* requires solar radiation sensor
Dew Point Yes Yes Yes Yes Yes*
Evapotranspiration Total Total Total requires solar radiation sensor
Soil Moisture Yes Yes Yes Yes Yes* requires soil moisture sensor
Leaf Wetness Yes Yes Yes No Yes* requires leaf wetness sensor
* Only stores the yearly high for the current year.
** Only stores monthly high for the current month.