


Graph Mode
35
Viewing Graphs
Although the graphs available may vary for each weather variable, you dis-
play the graphs in the same way.
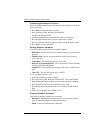
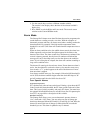
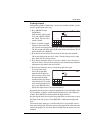
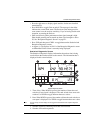
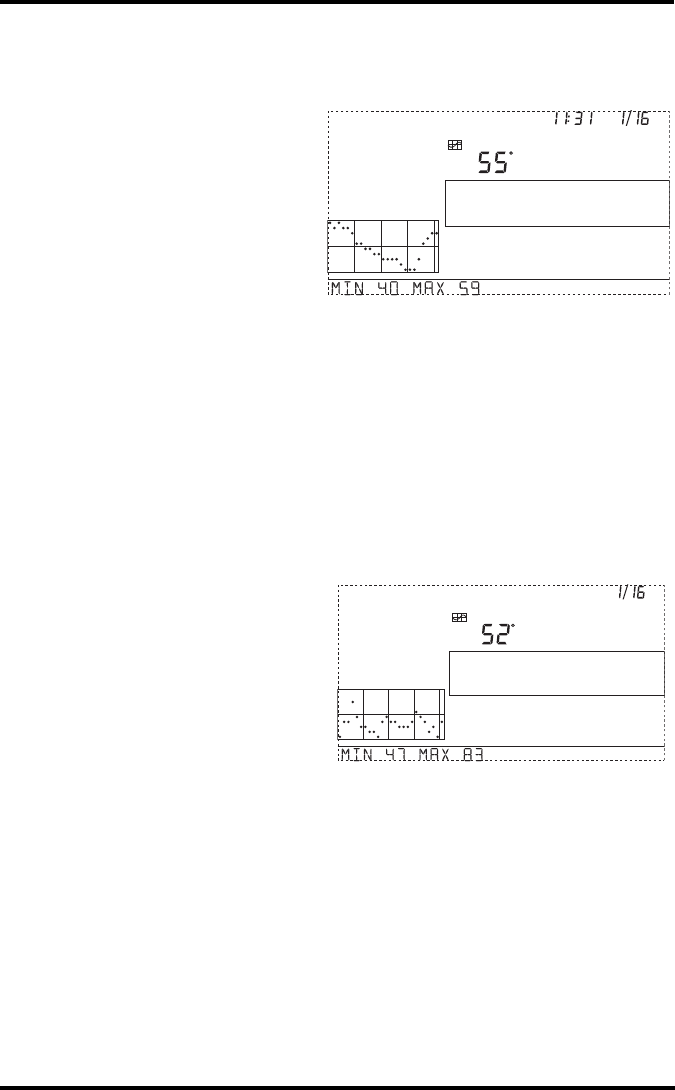
1. Press GRAPH to enter
Graph Mode.
Only the date, graph, graph
icon, and selected variable
are visible. The rest of the
screen is blank.
2. Select a variable to graph.
Values for the each of the
last 24 hours are displayed in the graph, each hour represented by a dot.
The dot at right end of the graph is the value for the current hour. You’ll
notice that the dot is blinking.
3. Press the left arrow and the second dot from the right starts to blink.
The screen displays the new dot’s value. The time display shows what
hour of the last 24 is being viewed.
4. Press the left and right arrows to view the variable’s values for each of
the last 24 hours. The console also displays the maximum and minimum
temperatures recorded in the last 24 hours.
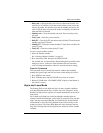
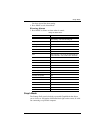
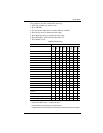
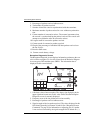
5. Press the up and down arrows to shift the graph’s time span.
If you press the down
arrow, the graph shifts
from the last 24 hours to
the last 24 days. Now each
dot represents the high
recorded on the day shown
in the date field. To see the
lows recorded in the last 24
days, press HI/LOW. Press
the left and right arrows to move between days.
By pressing the down arrow again, the graph shifts to show the highs of the
last 24 months. As before, use the right and left arrows to move between
months. Press HI/LOW to shift between the highs and lows.
By pressing the down arrow again, the graph shifts one more time to show
the highs of the last 24 years. Press HI/LOW to shift between highs and
lows.
The console beeps when you’ve reached the first or last possible value or
time span for the graph. Since the console only graphs data collected by the
station, the graphs can only show data collected since the station was first
installed.
GRAPH
Vertical Scale: 2
TEMP OUT
F
am
Last 24 hrs
hr
Every 1
GRAPH
Vertical Scale: 5
TEMP OUT
F
Last 24 days
day
Every 1
HIGHS