


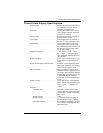

Console Data Display Specifications
50
Console Data Display Specifications
Historical Data . . . . . . . . . . . . . . . . . . . . . Includes the past 24 values listed un-
less otherwise noted; all can be
cleared and all totals reset.
Daily Data. . . . . . . . . . . . . . . . . . . . . . . . . Includes the earliest time of occur-
rence of highs and lows; period be-
gins/ends at 12:00 am.
Monthly Data . . . . . . . . . . . . . . . . . . . . . . Period begins/ends at 12:00 am on
the first of every month.
Yearly Data. . . . . . . . . . . . . . . . . . . . . . . . Period begins/ends at 12:00 am on
January 1
st
unless otherwise noted.
Current Data. . . . . . . . . . . . . . . . . . . . . . . Current data appears in the right
most column in the console graph
and represents the latest value within
the last period of the graph; totals
can be set or reset.
Graph Time Interval . . . . . . . . . . . . . . . . . 1 min., 10 min., 15 min., 1 hour, 1
day, 1 month, 1 year (user-select-
able, availability depends upon vari-
able selected).
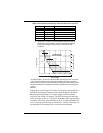
Graph Time Span . . . . . . . . . . . . . . . . . . . 24 Intervals + Current Interval (see
Graph Intervals to determine time
span).
Graph Variable Span (Vertical Scale) . . . . Automatic (varies depending upon
data range); Maximum and minimum
value in range appear in ticker.
Alarm Indication . . . . . . . . . . . . . . . . . . . . Alarms sound for 2 minutes (time
alarm is 2 minute) if operating on bat-
tery power. Alarm message displays
in ticker as long as threshold is met
or exceeded. Alarms can be si-
lenced, but not cleared, by pressing
DONE.
Update Interval . . . . . . . . . . . . . . . . . . . . . Varies with sensor - see individual
sensor specs. Also varies with trans-
mitter ID code - 1 = shortest, 8 =
longest.
Forecast:
Variables Used . . . . . . . . . . . . . . . . . Barometric reading & trend, wind
speed & direction, rainfall, tempera-
ture, humidity, latitude & longitude,
time of year.
Update Interval . . . . . . . . . . . . . . . . . I hour
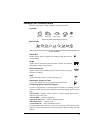
Display Format . . . . . . . . . . . . . . . . . Icons on top center of display; de-
tailed message in ticker at bottom.
Variables Predicted . . . . . . . . . . . . . . Sky condition, precipitation, Temper-
ature Changes, Wind Direction and
Speed Changes.