24
How to Interpret the Graphs (Continued)
5 Receive and save the data by selecting “Output PC” from “MCACC Data Check”.
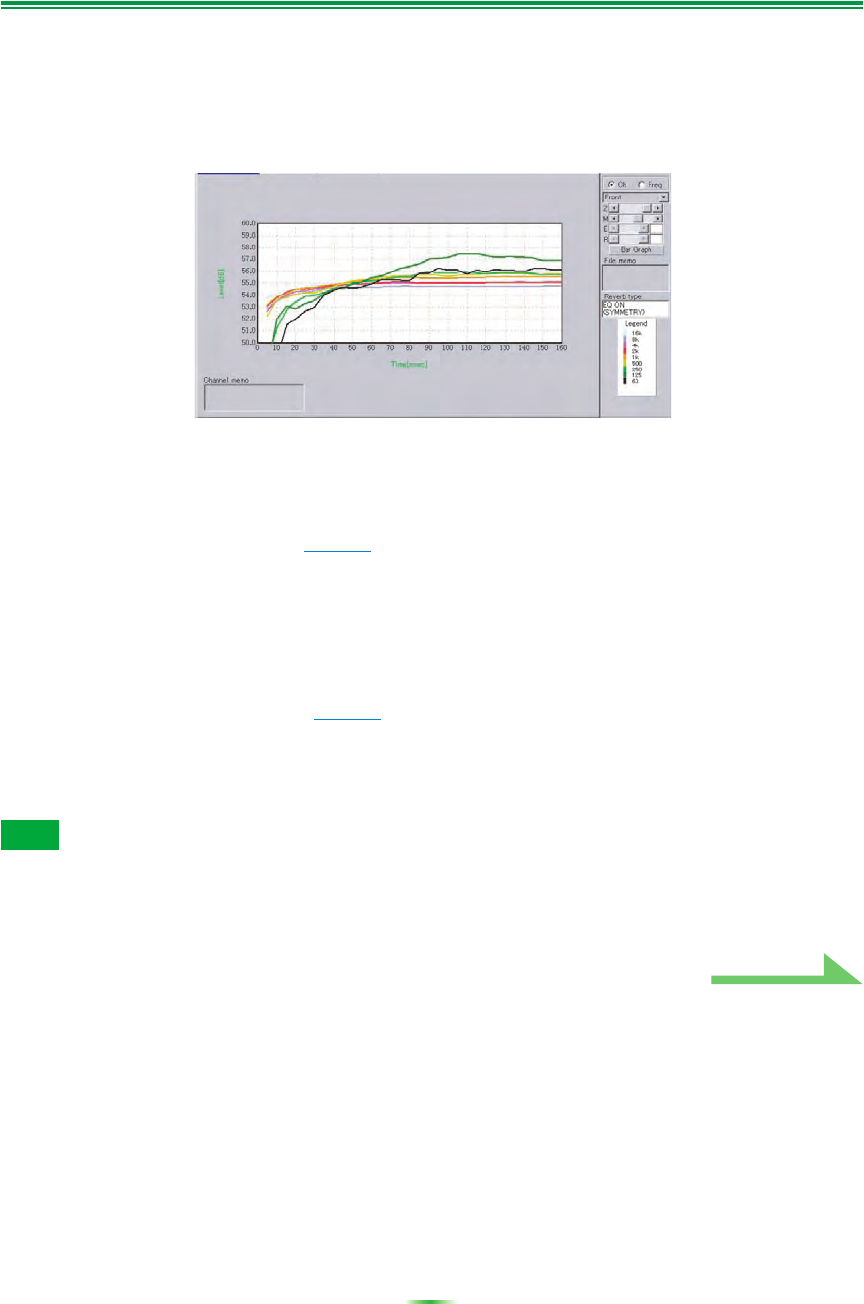
When you receive and save this information on your PC, you will be able to see the graph of your
listening area’s reverb characteristics with the equalization performed by this receiver (after calibration).
The following graph shows the reverb measurement results after Advanced EQ Setup calibration (with a
time period setting of 30-50ms):
About the types of displays of the graph for the reverb
characteristics after EQ calibration
For “SYMMETRY” or “FRONT ALIGN”
• The display type is set to “Pair Ch” (page 13). For reasons of the properties of the different EQ curves,
when the “Each Ch” display type is set, the reverb characteristics for the different channels do not line up
properly.
• The reverb characteristics prior to calibration are displayed in the “Each Ch” mode, so if you want to
compare the characteristics before and after calibration, set the display type prior to calibration to “Pair
Ch”. This way the number of channels before and after calibration are the same, allowing you to compare.
For “ALL CH ADJUST”
• The display type is set to “Each Ch” (page 13). For reasons of the properties of the EQ curves, when the
“Pair Ch” display type is set, the reverb characteristics for the different pairs of channels do not line up
properly.
• Since the “Each Ch” display type is set both before and after calibration, the graphs can be compared as
such.
• “Reverb Measurement” calibration data will be lost if the power is switched off.
• The graphs displaying reverb measurements both before and after calibration are displayed in 2-D for
comparison purposes.
Note
Continue


