58
Direction Whether the bar is to be displayed in the normal direction or the
reverse direction. (See note 1.)
Width The width of the bar graph. The width must be 3 dots or greater
to set a frame. The width must be 8 dots or greater when
displaying horizontal bars from the top of the screen or when
displaying vertical bars from the right of the screen.
Graph Frame Whether or not a graph frame showing 100% is to be displayed.
Disp sign Whether or not a negative (–) sign is to be displayed. If a
negative sign is used, the bar graph can be displayed in the
reverse direction for negative values. (See note 2.)
100% value The value of the denominator for percentage calculations. You
cannot set numerals of 0 or less as the 100% value.
Display % Whether or not the result of percentage calculations is to be
displayed as numerals.
Size of % Set the character size of numerals for when percentages are
displayed.
Scale Set the scale factor for the percentage display. The NT600M can
be set to 64X in addition to those shown above.
Note 1. Horizontal bar graphs can be displayed left to right or right to left. Vertical
bar graphs can be displayed top to bottom or bottom to top.
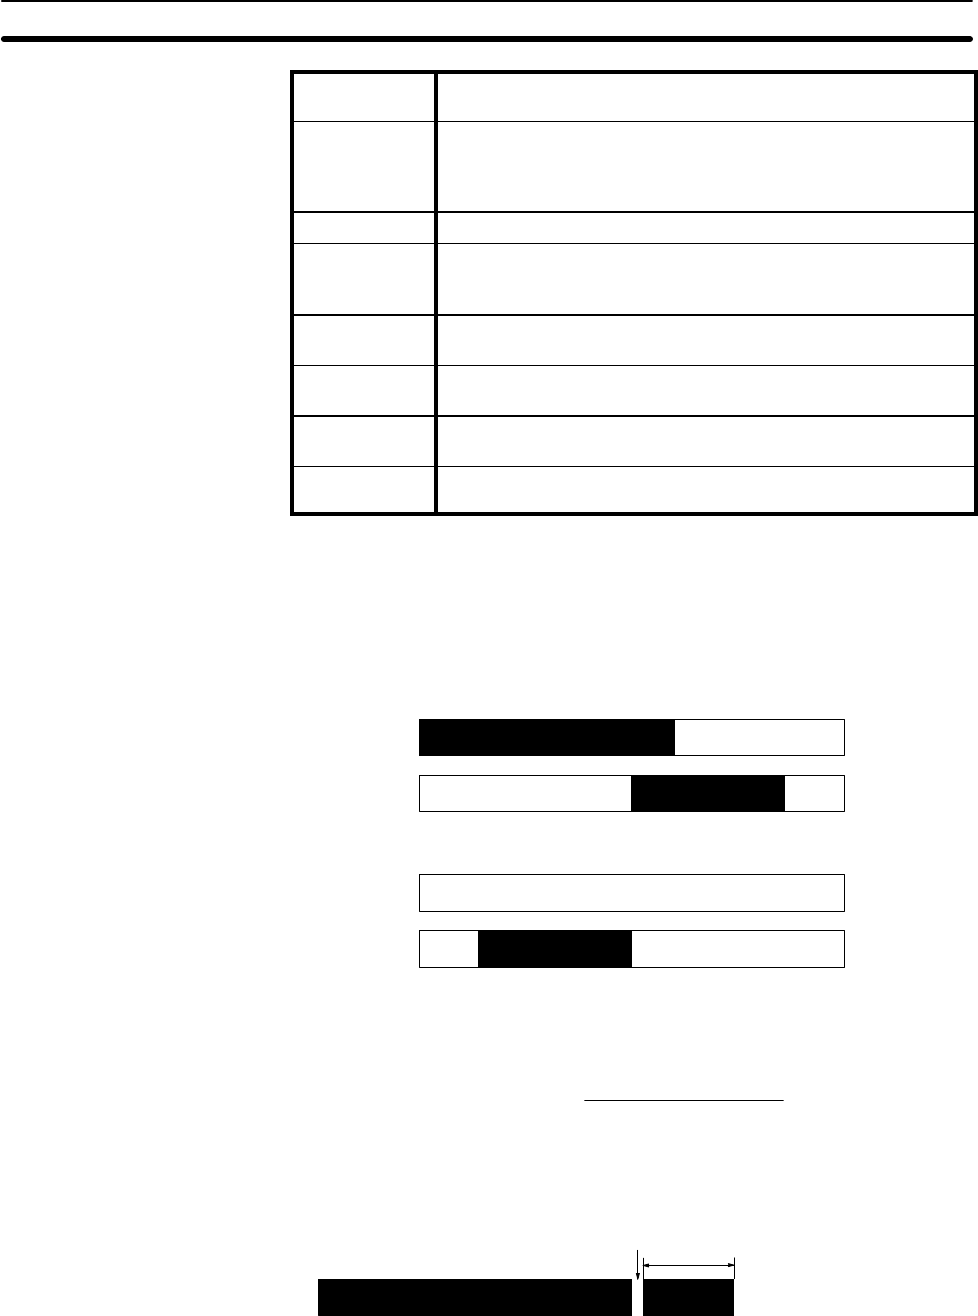
2. If a display sign (negative value) is specified, the center of the bar will be
set as 0% and the right or top of the bar will be set as 100% (for normal
displays). (The center will be one dot up or to the left of center for odd-
sized bars.) Examples are shown below.
Displaying 60%
Without sign
With sign
60%
60%
Displaying –60%
Without sign
With sign
0%
–60%
3. The following relationship exists between the number of display dots on
the screen, the content of the numeral table reference, and the 100% val-
ue.
(Number of display dots) = (Maximum length of graph) x
(Referenced numeral table)
(100% data value)
If the results for a bar graph display is over 100%, a 1-dot blank will be
displayed past the size set with the Support Tool and an 8-dot bar will be
display beyond the blank to indicate a value over 100% (see below).
1 dot
8 dots
Press the Enter Key after completing all of these settings.
When the display position has been set, you can return to set another bar
graph or you can continue pressing the Escape Key to return to the Initial
Edit Display.
Bar Graphs Section 2-6
