KODAK Display Manager System V4.0 User’s Guide 65
Verifying
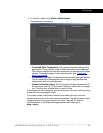
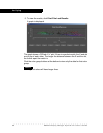
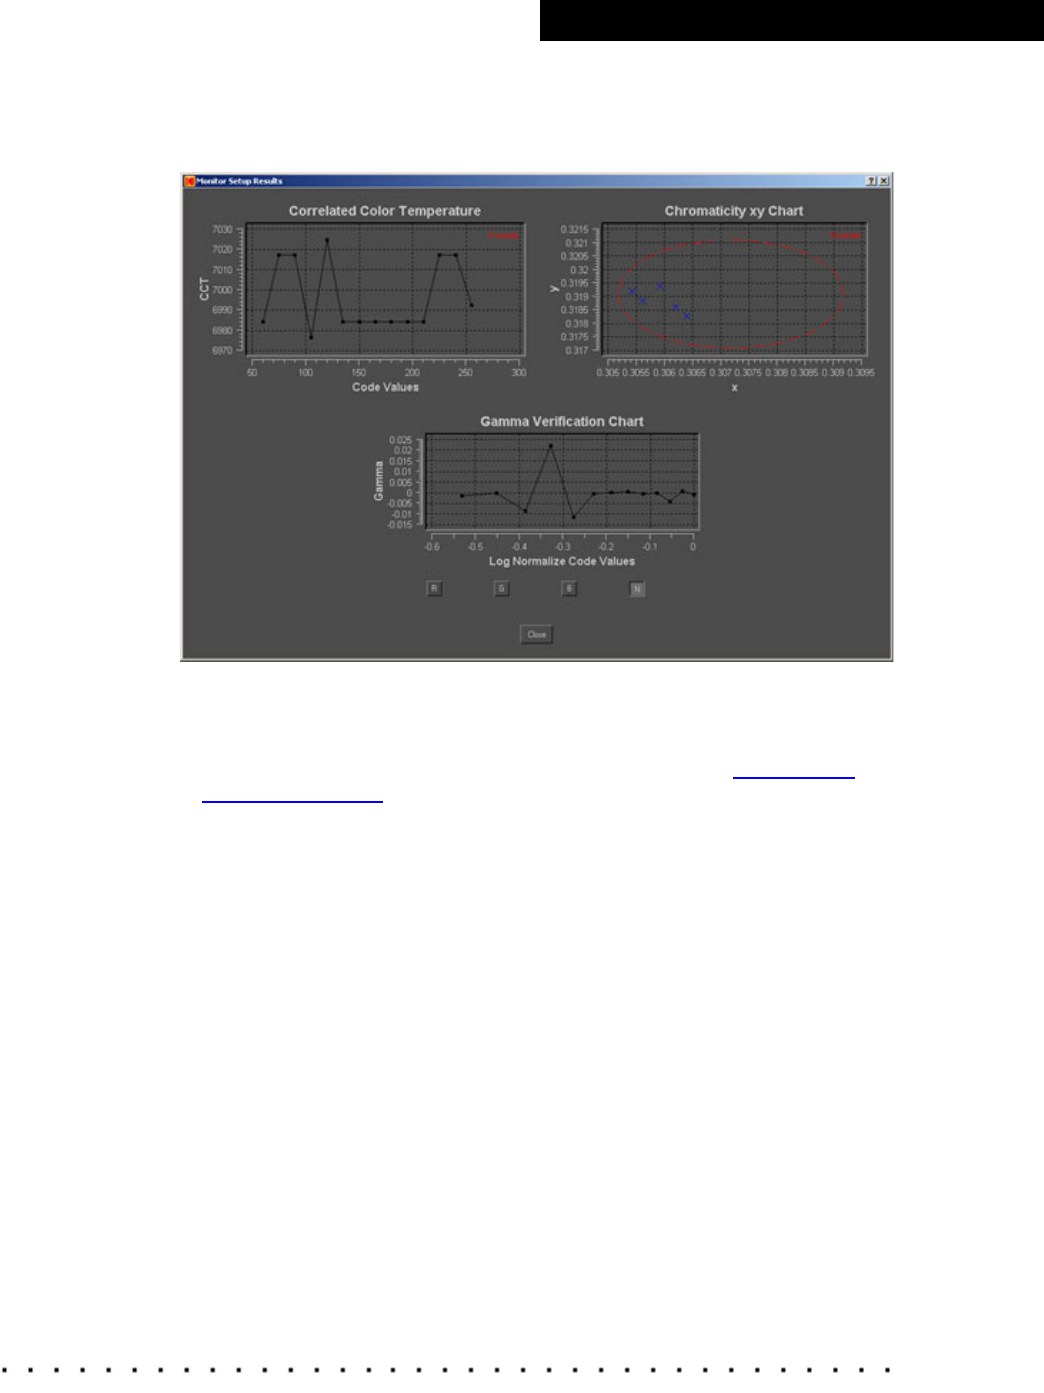
5. To view the results, click Monitor Setup Results.
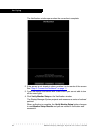
Three graphs are displayed.
• Correlated Color Temperature: This graph shows the tracking of the
grayscale CCTs across the range of code values that were measured.
The red lines indicate the tolerance levels that you entered on the Setup
window. These lines appear if the scale warrants. See “
Tolerances
Setup” on page 26
• Chromaticity xy Chart: This diagram shows the tolerance you defined.
The Xs indicate the chromaticities over a range of gray patches and
indicate how well your neutrals track.
• Gamma Verification Chart: This chart shows the gamma response of
the monitor for each R, G, B, N series. Ideally the values fall in a straight
line. Click the color channel that you want to view.
If the values are out of tolerance, you can continue to use your monitor as long
as the colors are acceptable to you.
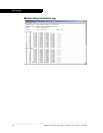
The system writes a verification results file containing the xyY and color
temperature data for each of the measured patches. The file is time and date
stamped so that you can plot trends over time, if desired. To view the
verification files, in the Display Manager system main folder go to
data > verify.


