


55
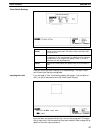
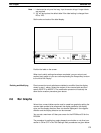
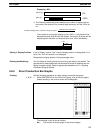
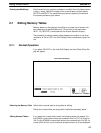
Displaying –60%
Without sign
With sign
0%
–60%
3. The following relationship exists between the number of display dots on
the screen, the content of the numeral table reference, and the 100% val-
ue.
(Number of display dots) = (Maximum length of graph) x
(Referenced numeral table)
(100% data value)
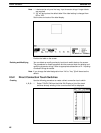
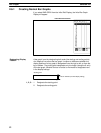
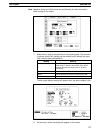
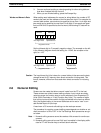
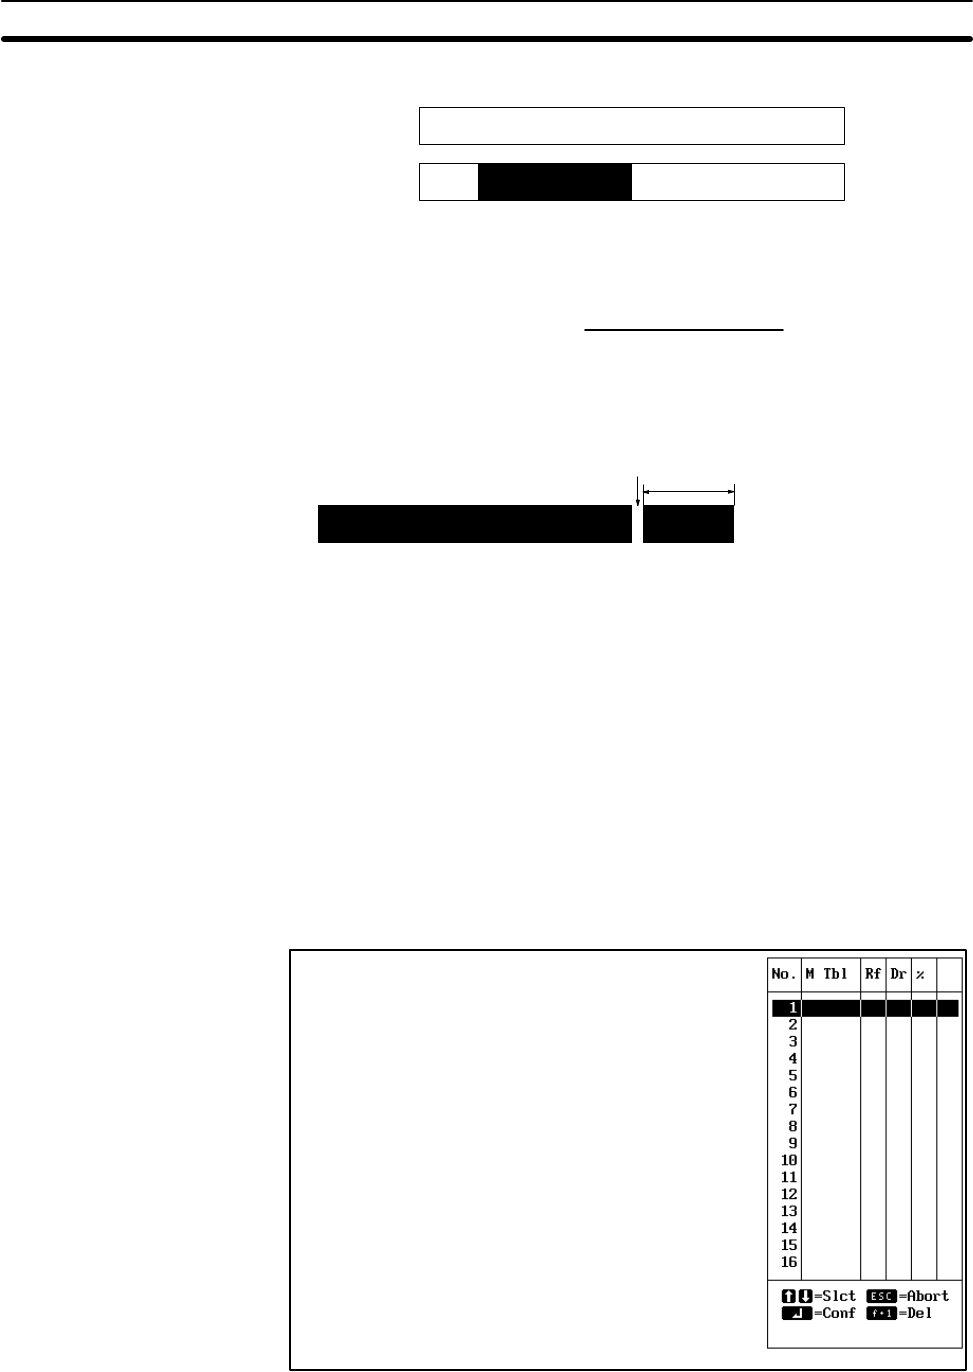
If the results for a bar graph display is over 100%, a 1-dot blank will be
displayed past the size set with the Support Tool and an 8-dot bar will be
display beyond the blank to indicate a value over 100% (see below).
1 dot
8 dots
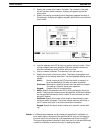
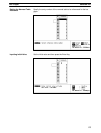
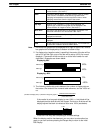
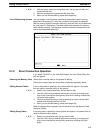
Setting % Display Position If the % Display is set to “Yes,” then the display position is designated. If it is
set to “No,” then this screen is not displayed.
Designate the display position of the percentage value.
Deleting and Modifying You can delete or modify previously input bar graph data on the screen. The
procedures for these operations are the same as those for deleting and mo-
difying character strings. Refer to appropriate subsections of
2-1 Inputting
Character Strings
for details.
2-6-2 Direct Connection Bar Graphs
Creating Use the following procedure to create a direct connection bar graph.
1, 2, 3...
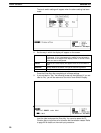
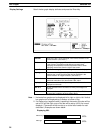
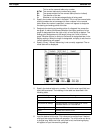
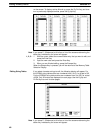
1. Select BAR GRPH from the Initial Edit Display, a list of the bar graphs
already existing in the current screen will be displayed.
The headings in this list are as follows:
No.: The number of the bar graph in the current display.
Bar Graphs Section 2-6