


23
Chapter 4
Displaying and Printing
Events
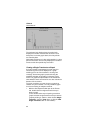
Displaying Events
EventView software enables you to view events in
different forms:
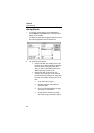
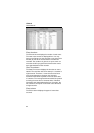
• The Events tab in the Site Report window lists all
events that the recorder has gathered.
• Sags, swells and transients can be displayed in a
Quick Summary bar graph.
• A single transient can be displayed as a graph.
• An Event Distribution Graph can be displayed.
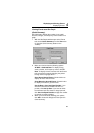
Viewing the Events Tab
Having downloaded events from the recorder, and with
the Events tab still open, you can view and analyze the
data that the recorder has gathered since it was last
cleared. The recorder can store up to 4,000 events.
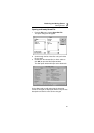
Events are displayed in the order of closing (end time).
An event that is closed (ended) most recently is
displayed at the top of the list.
Note
As events can occur simultaneously while their
duration differ, the display order can differ from
the order of their start times. For example,
during a sag event transients can occur.
Though the start time of the sag is earlier than
that of the transients, the sag event will be
displayed later in the list because its end time
is later.