


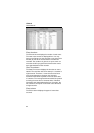
Displaying and Printing Events
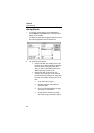
Displaying Events
4
27
#
Hot -
Neutral
Voltage Duration
Hot -
Neutral
Voltage Duration VER Data
1 100V
2
cycles 120V
1 hour
Sag 100V, 2 cycles
2 40V
2
cycles 120V
1 hour
Sag 40V, 2 cycles
3 100V
2
seconds 120V
1 hour
Sag 100V, 2 seconds
4 40V
2
seconds 120V
1 hour
Outage, 8-16 seconds
50V
2
cycles 120V
1 hour
Outage, 2 cycles
60V
2
seconds 120V
1 hour
Outage, 8-16 seconds
70V
2
seconds 100V
2 cycles
Outage, 8-16 seconds
80V
2
seconds 100V
2 seconds
Outage, 8-16 seconds
90V
2
cycles 100V
2 seconds
Outage, 2 cycles and
Sag, 2 seconds
10 100V
2
seconds 0V
2 cycles
Outage, 2 seconds
11 100V
2
cycles 0V
2 seconds
Outage, 8-16 seconds
12 100V
2
cycles 40V
2 seconds
Outage, 8-16 seconds
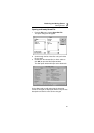
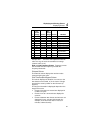
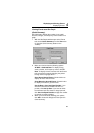
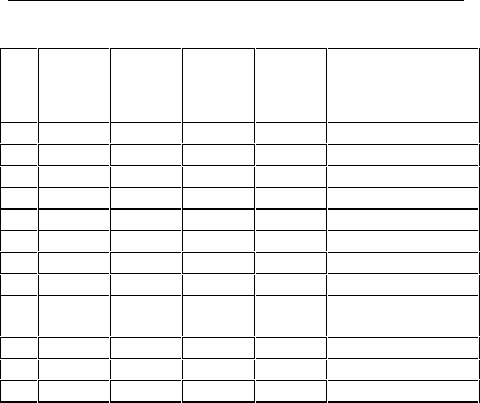
Example #10: Since the VER reports the extreme
value of a sag, the event is recorded as an outage
(extreme value of 0V).
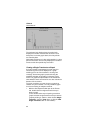
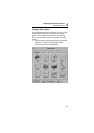
High and Low Frequency Events Frequency events
are recorded when the frequency exceeds the
frequency thresholds.
Extreme Column
The Extreme column displays the maximum value
measured during the event.
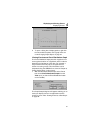
End Time/Duration/Degree Column
This column displays the duration of an event, or the
time that the event ended, or (in the case of a single
transient) the event’s position on the sine wave (in
degrees).
The way the information is displayed depends on the
length of the event.
• Events of less than one second are displayed in
numbers of cycles.
• Events of one to 119 seconds are displayed in
seconds.
• Events of between two minutes and 24 hours are
displayed in hours, minutes and seconds (for
example, 07:51:24, which means 7 hours, 51
minutes, and 24 seconds).