


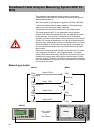
Broadband Cable Analysis Measuring System MSK 33 /
MVG
85
TRACK.
MVG10
<> mark
reflv
mvg10
only
►
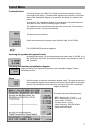
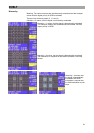
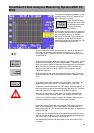
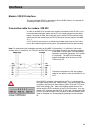
First select the reception frequency in the
reception menu TV or RP. With this, the
MVG 10 begins to „sweep.“
From the MODE menu,
man reaches track. MVG
10 the spectrum display
in MVG 10 tracking
mode with the second softkey.
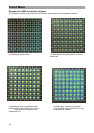
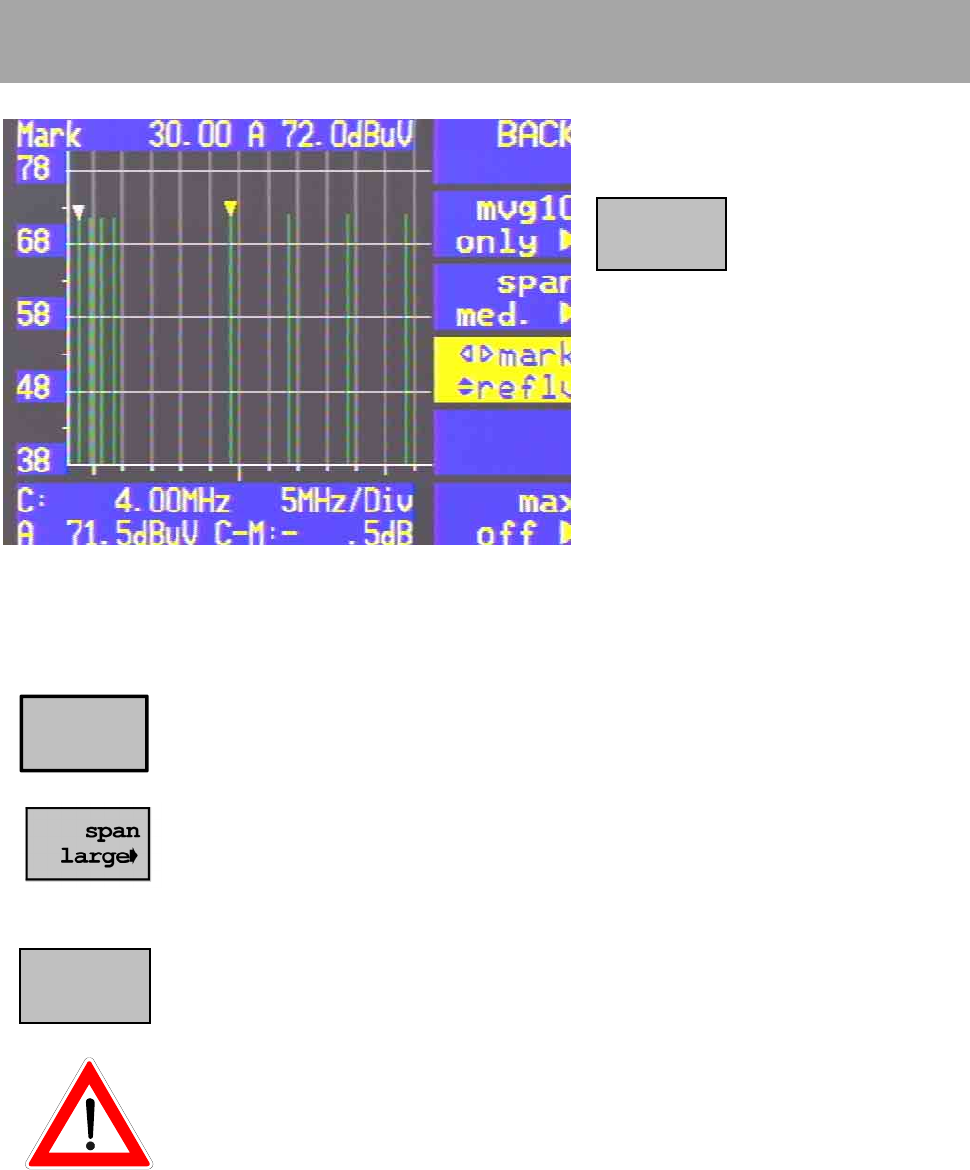
In this mode, all MVG signals in respect to
the frequency and level are recorded from
the starting frequency up to the end
frequency. In between, laying signals are
not recorded. In this mode, the highest
measuring speed can be reached (ca. 160
ms per represented spectral line).
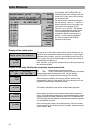
The less frequency points (spectral lines) you define for the MVG 10,
the faster the spectrum representation of the MSK 33 in „MVG 10
only-mode“ works. Therefore, enter in only required frequency points
for the MVG 10.
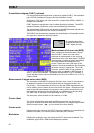
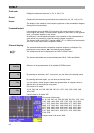
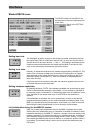
With the cursor buttons, ◄►, the position of the yellow marker can be
determined for frequency and level measurement. Frequency and
level of the yellow marker is displayed. By pressing the cursor buttons,
▲▼, the reference level can be changed in 4 dB increments (the
spectrum is moved up or down). Refer to the respective chapter
“Spectrum Analysis”!
By pressing this button, the represented frequency range can be de-
fined per scale part. Refer to the respective chapter “Spectrum Analy-
sis”!
By pressing this button, the spectrum is switched to „Max hold.“ By
repeatedly pressing this button, it switches again to ‚clear write‘.
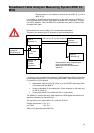
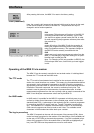
In this menu, press the buttons only very slowly, since the MSK 33 in
this mode always waits for the data reports of the MVG 10. Therefore,
press the buttons for a longer time until the MSK 33 reacts.
The red LED above the RF input lights up on MVG tracking mode.
This does not mean anything. There is not voltage on the RF input.
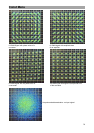
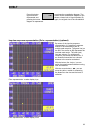
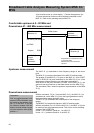
In this mode, all MVG signals in respect to frequency and level from
the starting frequency to the end frequency are recorded.
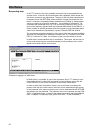
In-between laying signals are also recorded. The signals sent by the
MVG 10 are displayed in green (depending on the measurement
bandwidth green/red). The spectrum between the MVG 10 signals are
displayed in red.
In this mode, the step-time must be increased for the MVG 10 (each
according to the set span ca. 700...5000 ms pre represented spectral
line). Also, refer to the operating manual MVG 10.
The measured spectrums can be printed out via the function COPY -
print data.
☞
max
off
►