


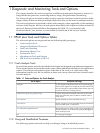
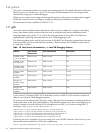

Table 1-2 Tools and Options for Debugging Hung and Deadlocked Processes
Description and UsageTool or Option
An HP-supported implementation of the gdb debugger
that has Java support. For simplicity, this document refers
to wdb/gdb as gdb from this point forward. gdb can be
used to attach to a running process.
wdb/gdb
Used to identify and diagnose performance problems in
Java applications running on HP-UX. It can also be used
to debug thread and heap issues.
HPjmeter
Used to retrieve thread dump information. It also executes
a deadlock detection algorithm and reports any deadlocks
detected involving synchronized code. Heap dumps are
also generated beginning with JDK 1.5.0.05 and SDK
1.4.2.11 when the -XX:+HeapDumpOnCtrlBreak option
is specified.
Ctrl-Break Handler
Used to observe memory allocation in a running Java
application by taking snapshots of the heap over time. It
can be set by providing the -XX:+HeapDump option or
setting the _JAVA_HEAPDUMP environment variable.
-XX:+HeapDump and _JAVA_HEAPDUMP Environment
Variable, starting with JDK 1.5.0.03 and SDK 1.4.2.10
Creates a core image of a running process.gcore (11.31 only)
Java language debugger.jdb
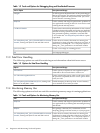
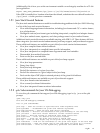
1.1.3 Fatal Error Handling
The following options are useful for retrieving more information when fatal errors occur:
Table 1-3 Options for Fatal Error Handling
Description and UsageOption
Used to specify a sequence of user-supplied scripts or
commands to be executed when a crash occurs.
-XX:OnError
Used to suspend the process when a crash occurs. After
the process is suspended, the user can use gdb to attach
to the Java VM.
-XX:+ShowMessageBoxOnError
Enables dumping of the heap when an out of memory
error condition occurs in the Java VM.
-XX:+HeapDumpOnOutOfMemoryError, starting with
SDK 1.4.2.11 and JDK 1.5.0.04
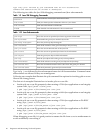
1.1.4 Monitoring Memory Use
The following options and tools are useful for monitoring memory usage of running applications:
Table 1-4 Tools and Options for Monitoring Memory Use
Description and UsageTool
Used to identify and diagnose performance problems in
Java applications by examining and monitoring the heap
and threads.
HPjmeter
HP's garbage collection (GC) visualization tool for
analyzing garbage collection activity in a Java program.
HPjtune
Used to observe memory allocation in a running Java
application by taking snapshots of the heap over time. It
can be set by providing the -XX:+HeapDump option or
setting the _JAVA_HEAPDUMP environment variable.
-XX:+HeapDump and _JAVA_HEAPDUMP Environment
Variable, starting with JDK 1.5.0.03 and SDK 1.4.2.10
14 Diagnostic and Monitoring Tools and Options