


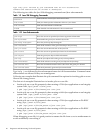
Table 1-11 HPjmeter 3.0 Features
Drill down into application profile metrics
• Graphic display of profiling data
• Call graphs with call count, or with CPU or clock time
• Per thread display of time spent
• Per thread or per process display
Integrated HPjtune functions with concurrent improvements in tool and help usability
Ability to examine Java Management Extension management beans (Mbeans) content and the Java VM internal
memory configuration
Automatic problem detection and alerts
• Memory leak detection alerts with leak rate
• Thread deadlock detection
• Abnormal thread termination detection
• Expected out of memory error
• Excessive method compilation
Dynamic real-time display of application behavior
• Java heap size
• Garbage collection events and percentage time spent in garbage collection
• CPU usage per method for hottest methods
Object allocation percentage by method
• Object allocation percentage by object type
• Method compilation count in the Java VM dynamic compiler
• Number of classes loaded by the Java VM
• Thrown exception statistics
• Multi-application, multi-node monitoring from a single console
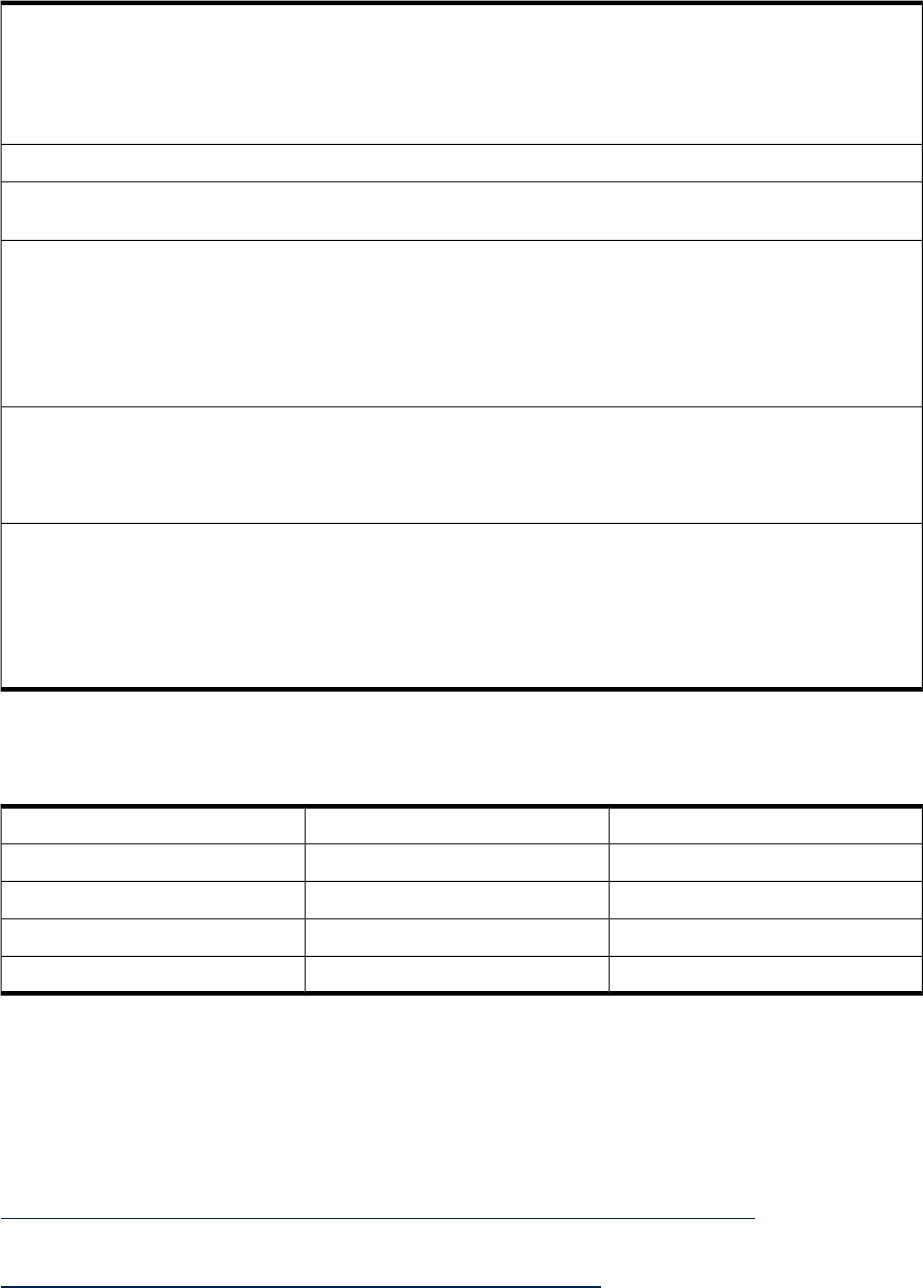
HPjmeter can display data generated by the following Java product versions, on the specified
architectures, with the specified HP-UX operating system, as detailed in the following table:
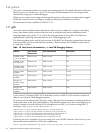
Table 1-12 Java SDKs and JDKs Supported by HPjmeter 3.0
HP-UX VersionsArchitectureJava Version
11.11, 11.23PA-RISC 1.1, PA-RISC 2.0SDK 1.4.2.02 or later
11.11, 11.23PA-RISC 2.0JDK 1.5 or later
11.22, 11.23IntegritySDK 1.4.2.02 or later
11.22, 11.23IntegrityJDK 1.5.x
The HPjmeter console can be run on:
• PA-RISC HP-UX 11.11, 11.23
• Integrity HP-UX 11.22, 11.23
• Windows XP/2000/NT
• Linux
The user's guide for HPjmeter may be found at:
http://www.hp.com/products1/unix/java/hpjmeter/infolibrary/user_guide.pdf
More information on HPjmeter may be found at:
http://www.hp.com/products1/unix/java/hpjmeter/index.html
1.7 HPjmeter 25