


Program terminated with signal 6, Aborted.
#0 0xc0214db0 in kill+0x10 () from ./libc.2
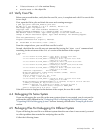
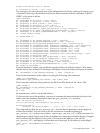
The first step is to look at the stack trace of the failing thread. Do this by issuing gdb's backtrace
command. Following is the backtrace which has been annotated with the comment “FAILED
HERE” at the point of failure:
(gdb) backtrace
#0 0xc0214db0 in kill+0x10 () from ./libc.2
#1 0xc01ab554 in raise+0x24 () from ./libc.2
#2 0xc01f1a78 in abort_C+0x160 () from ./libc.2
#3 0xc01f1ad4 in abort+0x1c () from ./libc.2
#4 0xc4042590 in os::abort+0x98 () from ./libjvm.sl
#5 0xc4145f24 in VMError::report_and_die+0xcc4 () from ./libjvm.sl
#6 0xc40463e4 in os::Hpux::JVM_handle_hpux_signal+0x2bc () from ./libjvm.sl
#7 0xc40419dc in os::Hpux::signalHandler+0x4c () from ./libjvm.sl
#8 <signal handler called>
*** FAILED HERE ***
#9 0xc3ed2ec8 in get_method_id+0x128 () from ./libjvm.sl
#10 0xc3ed34d0 in jni_GetStaticMethodID+0xf0 () from ./libjvm.sl
#11 0xc00bf398 in Java_StackTrace_dumpCore+0xf8 () from ./libstacktrace.sl
#12 0x77c09e54 in interpreted frame: StackTrace::dumpCore (int) ->java.lang.String
#13 0x77c02e08 in interpreted frame: StackTrace::methodMakeCall (int) ->void
#14 0x77c02ee4 in interpreted frame: StackTrace::method3 (int) ->void
#15 0x77c02ee4 in interpreted frame: StackTrace::method2 (int) ->void
#16 0x77c02ee4 in interpreted frame: StackTrace::method1 (int) ->void
#17 0x77c02ee4 in interpreted frame: StackTrace::main (java.lang.String[]) ->void
#18 0x77c00100 in Java entry frame
#19 0xc3ec1f08 in JavaCalls::call_helper+0x1d8 () from ./libjvm.sl
#20 0xc403d664 in os::os_exception_wrapper+0x34 () from ./libjvm.sl
#21 0xc3ec1d04 in JavaCalls::call+0x8c () from ./libjvm.sl
#22 0xc3ed0ad0 in jni_invoke_static+0x1d8 () from ./libjvm.sl
#23 0xc3ee8214 in jni_CallStaticVoidMethod+0x15c () from ./libjvm.sl
#24 0x581c in main+0xb14 ()
From the backtrace output, you see that the signal handler was called in frame 8. That means
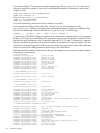
that the failure was in frame 9. Following is the address where the failure took place in frame 9:
#9 0xc3ed2ec8 in get_method_id+0x128 () from ./libjvm.sl
Print out the instruction at this address by using the following gdb command:
(gdb) x/i 0xc3ed2ec8
0xc3ed2ec8 <get_method_id()+0x128>: ldw 0(%r6),%r26
This instruction loads the value pointed to by R6+0 into R26. Print out the value of R6:
(gdb) frame 9
#9 0xc46d2ec8 in get_method_id+0x128 () from ./libjvm.sl
(gdb) p/x $r6
$1 = 0x0
R6 contains zero, which is an invalid address.
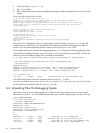
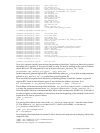
To discover the root of the problem, you need to examine the instructions that lead up to the
failure. Start by obtaining information about the get_method_id() function:
(gdb) info functions get_method_id
All functions matching regular expression "get_method_id":
Non-debugging symbols:
0xc3ed2da0 get_method_id(JNIEnv_ *, _jclass *, char *, char *, bool, Thread *)
This output shows that the get_method_id() function has six parameters and it begins at
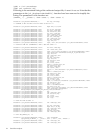
address 0xc3ed2da0. You now want to list the instructions from the beginning of
get_method_id() to the point of failure, which is get_method_id()+0x128 (see frame 9 in
the backtrace output). Before you do this, determine how many instructions to display. Compute
this by subtracting the address at the point of failure from the address of the start of
get_method_id(), dividing by 4 (since there are 4 bytes per 32–bit address), and adding 1:
(gdb) print (0xc3ed2ec8-0xc3ed2da0)/4 + 1
$7 = 75
4.7 Example gdb Session 69