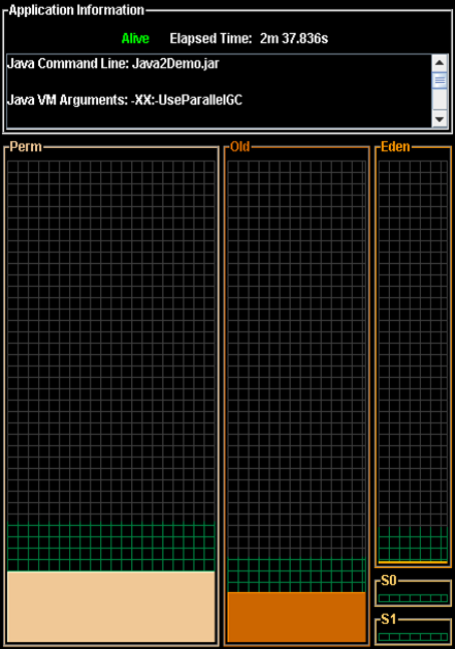
1. Application Information window
2. Graph window
3. Survivor Age Histogram window (optional)
The Survivor Age Histogram window is only available when Parallel Scavenge is in use
(-XX:+UseParallelGC or -XX:+AggressiveHeap options).
Following is an example visualgc Application Information window and a description of the
different window areas:
Figure 1-17 visualgc
Application Information
Window
The top panel of this window is labelled Application Information . This panel has an Alive/Dead
indicator and the elapsed time since the start of the Java application. Following this panel there
is a scrollable text area that lists miscellaneous information about the configuration of the target
Java application and the Java VM. This section includes main class or jar file name, the arguments
to the class's main method, arguments passed to the Java VM, and the values of certain Java
properties exported as instrumentation objects.
The bottom panel shows a graphical view of the spaces that make up the generational garbage
collection system. This panel is divided into three vertical sections, one for each of the generations:
the Perm generation, the Old (or Tenured) generation, and the Young generation. The Young
generation is comprised of three separate spaces, the Eden space, and two Survivor spaces, S0
and S1.
The screen areas representing the various spaces are sized in proportion to the maximum capacities
of the spaces. The screen areas for the three GC generations are of fixed size and do not vary
over time. Each space is filled with a unique color indicating the current utilization of the space
relative to its maximum capacity. The unique color for each space is used consistently among
this window and the other two visualgc windows (Graph and Survivor Age Histogram).
The Graph window displays the values of various statistics as a function of time. The resolution
of the horizontal axis of the graph is determined by the interval command-line argument,
1.23 visualgc 43
