


Type "help java" followed by java subcommand name for full documentation.
Command name abbreviations are allowed if unambiguous.
The following two tables list Java VM debugging commands and Java subcommands:
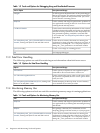
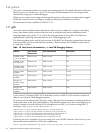
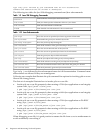
Table 1-9 Java VM Debugging Commands
Print backtrace of mixed Java and native frames
backtrace
Print Java frame specific information if this is a Java frame
info frame
Print state information for all threads
info threads
Print detailed state information for the current thread
thread
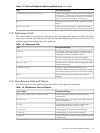
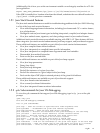
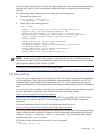
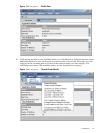
Table 1-10 Java Subcommands
Show the current or specified Java frame arguments information
java args
Disassemble the given Java method's bytecodes
java bytecodes
Show the Java heap object histogram
java heap-histogram
Find all the instances of the given klassOop in the Java heap
java instances
Show the current internal state of the Java VM
java jvm-state
Show the current or specified Java frame locals information
java locals
Print the given Java object's fields information
java object
Find the Java object OOP of the given Java heap address
java oop
Find all the references to the given Java object in the Java heap
java references
Show the unwind information of the code where the given pc is located
java unwind-info
Print the dynamically generated Java unwind table
java unwind-table
Type help java followed by the subcommand name for full documentation. Command name
abbreviations are allowed if they are unambiguous.
Following are examples that illustrate the gdb command-line options for invoking gdb on a core
file and on a hung process.
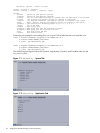
The first set of examples illustrate how to invoke gdb on a core file:
• Invoke gdb on a core file generated when running a 32-bit Java application on an Integrity
system with /opt/java1.4/bin/java:
$ gdb /opt/java1.4/bin/IA64N/java core.java
• Invoke gdb on a core file generated when running a 64-bit Java application on an Integrity
system with /opt/java1.4/bin/java -d64:
$ gdb /opt/java1.4/bin/IA64W/java core.java
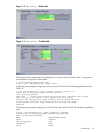
• Invoke gdb on a core file generated when running a 32-bit Java application on PA-RISC
using /opt/java1.4/bin/java:
$ gdb /opt/java1.4/bin/PA_RISC2.0/java core.java
• Invoke gdb on a core file generated when running a 64-bit Java application on PA-RISC
using /opt/java1.4/bin/java:
$ gdb /opt/java1.4/bin/PA_RISC2.0W/java core.java
When debugging a core file, it is good practice to rename the file from core to another name to
avoid accidentally overwriting it.
20 Diagnostic and Monitoring Tools and Options