


2 Useful System Tools for Java Troubleshooting
This chapter contains information about some system tools available on HP-UX that are useful
when troubleshooting Java application problems. The tools discussed include: GlancePlus, tusc,
Prospect, HP Caliper, sar, vmstat, iostat, swapinfo, top, netstat, and others.
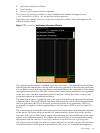
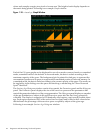
2.1 GlancePlus
GlancePlus is a system performance monitoring and diagnostic tool. It lets you easily examine
system activities, identify and resolve performance bottlenecks, and tune your system for more
efficient operation. For more information on GlancePlus, refer to the following website:
http://www.managementsoftware.hp.com/products/gplus/index.html
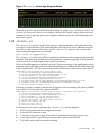
2.2 tusc
tusc gives you another view into the system activity, in addition to Java stack traces, GlancePlus,
and HPjmeter . It has many options, which you can display by entering the command tusc
-help. For more information on tusc, refer to the following website:
http://h21007.www2.hp.com/dspp/tech/tech_TechDocumentDetailPage_IDX/1,1701,2894,00.html?jumpid=reg_R1002_USEN
2.3 Prospect
Prospect is a performance analysis tool. Beginning with Prospect revision 2.2.0, you can use
Prospect to retrieve a profile of the compiled Java methods that the Java VM compiler creates in
data space. In order to activate this functionality, you must have SDK 1.3.1.02 or following
releases. For more information on the Prospect performance analysis tool, refer to the following
website:
http://h21007.www2.hp.com/dspp/tech/tech_TechSoftwareDetailPage_IDX/1,1703,3282,00.html
2.4 HP Caliper
HP Caliper is a general-purpose performance analysis tool for applications running on Integrity
systems. It helps you understand the execution of your applications and identify ways to improve
their performance. For more information on the HP Caliper tool, refer to the following website:
http://h21007.www2.hp.com/dspp/tech/tech_TechSoftwareDetailPage_IDX/1,1703,1174,00.html?jumpid=reg_R1002_USEN
2.5 sar
The sar command is a tool to report various system activities, such as CPU, I/O, context switches,
interrupts, page faults, and other kernel actions. For more information on this command, refer
to the following website:
http://docs.hp.com/en/B2355-60127/sar.1M.html
2.6 vmstat
The vmstat command reports statistics about the process, virtual memory, trap, and CPU
activity. For more information on this command, refer to the following website:
http://docs.hp.com/en/B2355-60127/vmstat.1.html
2.7 iostat
The iostat command iteratively reports I/O statistics for each active disk on the system. For
more information on this command, refer to the following website:
http://docs.hp.com/en/B2355-60127/iostat.1.html
2.1 GlancePlus 51