


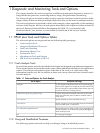
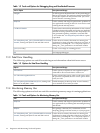
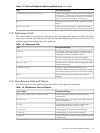
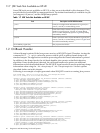
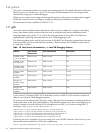
1.1.7 JDK Tools Not Available on HP-UX
Some JDK tools are not available on HP-UX, so they are not described in this document. They
are provided in JavaSoft JDK as unsupported tools. Equivalent functionality is available via gdb
Java support, HPjmeter, and the HeapDump options.
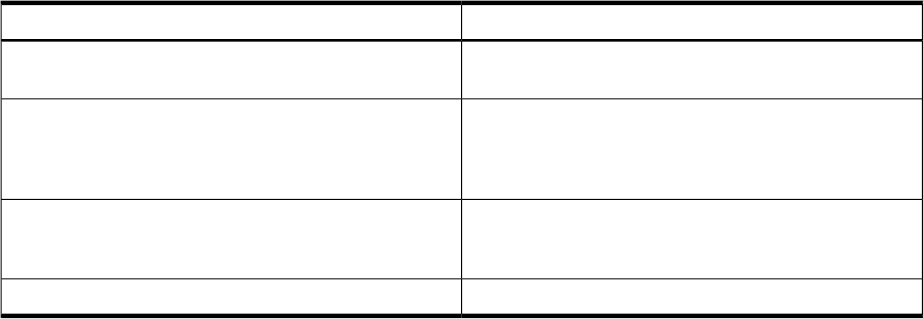
Table 1-7 JDK Tools Not Available on HP-UX
Description and HP-UX AlternativeTool
Prints Java configuration information for a given Java
process, core file, or remote debug server.
jinfo
Prints shared object memory maps or Java heap memory
details of a given process, core file, or remote debug
server. Use the HeapDump options or gdb heap dump
functionality instead.
jmap
Prints a Java stack trace of Java threads for a given Java
process, core file, or remote debug server. Use gdb stack
trace back functionality instead.
jstack
Not yet ported to HP-UX.Serviceability Agent (SA)
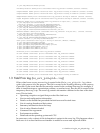
1.2 Ctrl-Break Handler
A thread dump is printed if the Java process receives a SIGQUIT signal. Therefore, issuing the
command kill -3 <pid> causes the process with id <pid> to print a thread dump to its
standard output. The application continues processing after the thread information is printed.
In addition to the thread stacks, the ctrl-break handler also executes a deadlock detection
algorithm. If any deadlocks are detected, the ctrl-break handler also prints out additional
information on each deadlocked thread. The SIGQUIT signal can also be used to print heap dump
information when using the -XX:+HeapDump or -XX:+HeapDumpOnCtrlBreak options
described further on in this chapter.
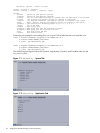
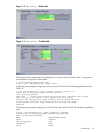
Following is an example of output generated when SIGQUIT is sent to a running Java process:
Full thread dump [Thu Oct 12 14:00:56 PDT 2006] (Java HotSpot(TM) Server
VM 1.5.0.03 jinteg:02.13.06-21:25 IA64 mixed mode):
"Thread-3" prio=10 tid=00a78480 nid=24 lwp_id=2669798 runnable [0bfc0000..0bfc0ae0]
at java.lang.Math.log(Native Method)
at spec.jbb.JBButil.negativeExpDistribution(JBButil.java:795)
at spec.jbb.TransactionManager.go(TransactionManager.java:234)
at spec.jbb.JBBmain.run(JBBmain.java:258)
at java.lang.Thread.run(Thread.java:595)
"Thread-2" prio=2 tid=009fb7a0 nid=23 lwp_id=2669797 runnable [0c1c0000..0c1c0b60]
at spec.jbb.Order.dateOrderlines(Order.java:341)
- waiting to lock <444ba618> (a spec.jbb.Order)
at spec.jbb.DeliveryTransaction.process(DeliveryTransaction.java:213)
at spec.jbb.DeliveryHandler.handleDelivery(DeliveryHandler.java:103)
at spec.jbb.DeliveryTransaction.queue(DeliveryTransaction.java:363)
- locked <154927e8> (a spec.jbb.DeliveryTransaction)
at spec.jbb.TransactionManager.go(TransactionManager.java:431)
at spec.jbb.JBBmain.run(JBBmain.java:258)
at java.lang.Thread.run(Thread.java:595)
"Thread-1" prio=10 tid=008ffa80 nid=22 lwp_id=2669796 runnable [0c3c0000..0c3c0de0]
at spec.jbb.infra.Collections.longStaticBTree.get(longStaticBTree.java:1346)
at spec.jbb.Warehouse.retrieveStock(Warehouse.java:307)
at spec.jbb.Orderline.validateAndProcess(Orderline.java:341)
- locked <48563610> (a spec.jbb.Orderline)
at spec.jbb.Order.processLines(Order.java:289)
- locked <48563128> (a spec.jbb.Order)
at spec.jbb.NewOrderTransaction.process(NewOrderTransaction.java:282)
at spec.jbb.TransactionManager.go(TransactionManager.java:278)
at spec.jbb.JBBmain.run(JBBmain.java:258)
at java.lang.Thread.run(Thread.java:595)
"Thread-0" prio=2 tid=00781240 nid=21 lwp_id=2669795 runnable [0c5c0000..0c5c0e60]
at spec.jbb.infra.Util.DisplayScreen.privIntLeadingZeros(DisplayScreen.java:448)
at spec.jbb.infra.Util.DisplayScreen.putDollars(DisplayScreen.java:1214)
at spec.jbb.NewOrderTransaction.secondDisplay(NewOrderTransaction.java:416)
- locked <154d4828> (a spec.jbb.NewOrderTransaction)
at spec.jbb.TransactionManager.go(TransactionManager.java:279)
at spec.jbb.JBBmain.run(JBBmain.java:258)
16 Diagnostic and Monitoring Tools and Options