


Additionally, this is how you set the environment variable on an Integrity machine for a 32–bit
Java application:
export GDB_JAVA_UNWINDLIB=/opt/java1.4/jre/lib/IA64N/server/libjunwind.so
If the SDK is installed in a location other than the default, substitute the non-default location for
/opt/java1.4 in the previous commands.
1.5.1 Java Stack Unwind Features
The Java stack unwind features are useful for troubleshooting problems in the Java VM. Following
is a list of the Java stack unwind features:
• View mixed language frames information, including Java frames and C/C++ native frames,
in a gdb backtrace.
• Distinguish various Java frame types including interpreted, compiled, and adapter frames.
• View Java method name, signature, and class package name for Java method frames.
Additional stack unwind features are available starting with SDK 1.4.2. These features fall into
three categories: Java stack unwind enhancements, Java heap support, and Java threads support.
These additional features are available as part of the Java stack unwind enhancements:
• View Java compiled frame inlined methods.
• View Java interpreted or compiled frame specific information.
• View Java interpreted or compiled frame arguments and local variables.
• Disassemble Java method bytecodes.
• Print out the Java unwind table.
These additional features are available as part of the Java heap support:
• View Java heap parameters.
• Dump Java object.
• Print Java heap histogram.
• Find all the instances of a given Java class.
• Find all the references to a given object in the Java heap.
• Find out the object OOP (object-oriented pointer) of the given field address.
These additional features are available as part of Java threads support:
• View Java threads state information.
• View current Java thread information.
• View Java interpreted frame monitors information.
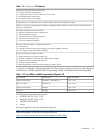
1.5.2 gdb Subcommands for Java VM Debugging
To view the gdb commands that support Java VM debugging, type help java at the gdb
prompt.
(gdb) help java
Java and JVM debugging commands.
List of java subcommands:
java args -- Show the current or specified Java frame arguments info
java bytecodes -- Disassemble the given Java method's bytecodes
java heap-histogram -- Show the Java heap object histogram
java instances -- Find all the instances of the given klassOop in the Java heap
java jvm-state -- Show Java virtual machine's current internal states
java locals -- Show the current or specified Java frame locals info
java mutex-info -- Print out details of the static mutexes
java object -- Print out the given Java object's fields info
java oop -- Find the Java object oop of the given Java heap address
java references -- Find all the references to the given Java object in the Java heap
java unwind-info -- Show the unwind info of the code where the given pc is located
java unwind-table -- Print out the dynamically generated Java Unwind Table
1.5 gdb 19