


1.7.1 Static Data Analysis
1.7.1.1 Using HPjmeter to Analyze Profiling Data
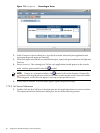
The following steps summarize how to use HPjmeter to save and view profiling information
from your applications.
1. Change the command line of your Java application to use -Xeprof, -agentlib:hprof,
or -Xrunhprof options to capture profiling data. For examples how to use the
-agentlib:hprof and -Xrunhprof options, refer to the hprof section. This section's
examples use the -Xeprof option.
If you are using a Java release prior to JDK 1.5.0.04, you will need to add the -Xeprof
command-line option. This option will gather the eprof data during the entire execution of
the launched Java application. An example using this option follows:
$ java -Xeprof yourApp
You can send the eprof output to a specified file using the file= keyword as follows:
$ java -Xeprof:file=yourApp_pid<pid>.eprof yourApp
NOTE: If you are running JDK 1.5.0.04 or later, the command-line option is not required
in order to capture eprof data. Instead you can toggle eprof data gathering on and off by
sending signals to the currently running Java VM. One log file is produced per sample
period; the name for the log file is java<pid>_<startTime>.eprof.
The SIGUSR2 signal toggles the recording of eprof data. Use the following process to gather
eprof data for specific periods:
• Send SIGUSR2 to the Java VM process. The Java VM will begin recording eprof data.
• Send SIGUSR2 to the Java VM process. The Java VM will flush eprof data and close the
log file.
See Profiling with Zero Preparation in the HPjmeter User's Guide for more information.
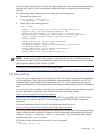
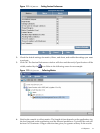
2. Run the application to create a data file.
3. Start the console from a local installation on your client workstation.
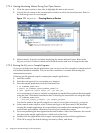
4. Click File—>Open File to browse for and open the data file.
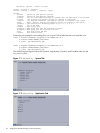
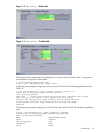
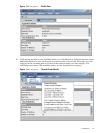
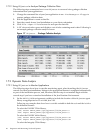
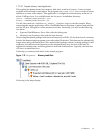
5. A profile analysis window will open displaying a set of tabs containing summary and
graphical metric data. The following screen shows an example:
26 Diagnostic and Monitoring Tools and Options