


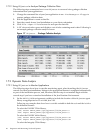
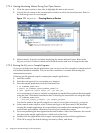
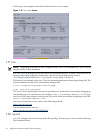
1.7.2.4 Viewing Monitoring Metrics During Your Open Session
1. Click the open session or time slice to highlight the data to be viewed.
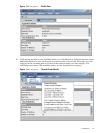
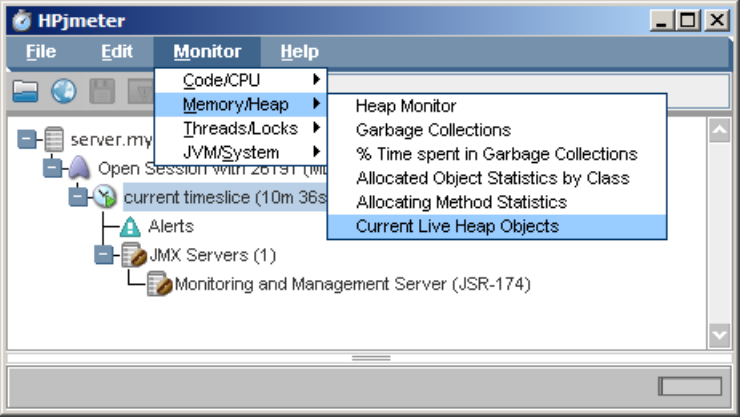
2. Use the Monitor menu on the console main window to select the desired metrics. Refer to
the following screen for an example:
Figure 1-11 HPjmeter - Choosing Metrics to Monitor
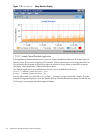
3. Select a metric. A metric visualizer displaying the chosen data will open. Refer to the
HPjmeter User’s Guide for details on individual metrics and how to interpret the data.
1.7.2.5 Running the HPjmeter Sample Programs
HPjmeter includes two sample applications you can run to see live examples of a memory leak
and a thread deadlock situation. You can use the visualizers to examine data during the
demonstration session.
Following are the general steps for running the sample applications:
1. Start the console.
2. Start the node agent if it is not running as a daemon.
3. Start the sample application from the command line:
$ cd $JMETER_HOME/demo
$ export LD_LIBRARY_PATH=$JMETER_HOME/lib
$ java -agentlib:jmeter agent.jar -jar ML1.jar
As a convenience, HPjmeter includes a script that sets up the library path and bootclasspath
using the Java VM found at installation time. Following are instructions for using this script:
$ cd $JMETER_HOME/demo
$ ../bin/run_simple_jvmagent -jar sample_program
Use the file name of the specific sample you want to run in place of sample_program.
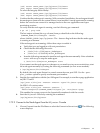
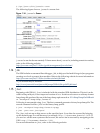
4. In the console main window, select Connect and type in the host name of the machine
running the sample application. If you specified a port number when starting the node agent,
use the same port number. Otherwise, leave the port number box empty.
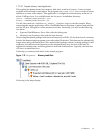
5. An icon representing the host appears in the main window. After a few moments, the console
also shows the sample application as a child node of the host.
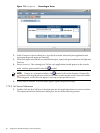
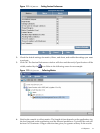
6. Double-click the application node to open a monitoring session with the application.
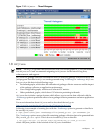
7. Click OK to accept the default settings for metrics, filters, and alerts.
32 Diagnostic and Monitoring Tools and Options