


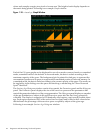
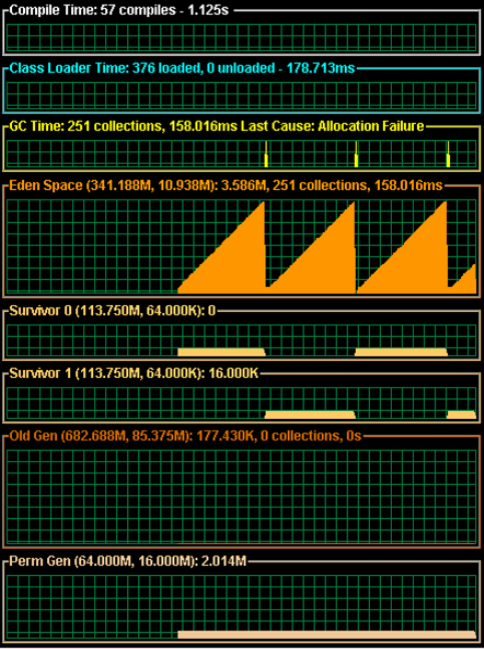
where each sample occupies two pixels of screen area. The height of each display depends on
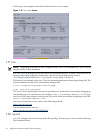
the metric being plotted. Following is an example Graph window:
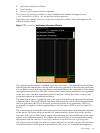
Figure 1-18 visualgc
Graph
Window
Each of the GC space graphs can be displayed in one of two modes: reserved mode or committed
mode; committed mode is the default. In reserved mode, the data is scaled according to the
maximum capacity of the space. The background grid is painted in dark gray to represent the
uncommitted portion and in green to represent the committed portion of reserved memory. In
committed mode, the data is scaled according to the current capacity of the space. The mode can
be toggled by right-clicking over the space and checking or unchecking the "Show Reserved
Space" check box.
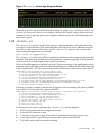
The Survivor Age Histogram window consist of two panels, the Parameters panel and the Histogram
panel. The Parameters panel displays the size of the survivor spaces and the parameters that
control the promotion behavior of the young generation. The Histogram panel displays a snapshot
of the age distribution of objects in the active survivor space after the last Young generation
collection. The display is comprised of 32 identically sized regions, one for each possible object
age. Each region represents 100% of the active Survivor Space and is filled with a colored area
that indicates the percentage of the survivor space occupied by objects of the given age.
Following is an example Survivor Age Histogram window:
44 Diagnostic and Monitoring Tools and Options