SurfControl Web Filter v5.5 Administrator’s Guide 9
B
ASIC
C
ONFIGURATION
Initial Monitored Data Settings
2
INITIAL MONITORED DATA SETTINGS
This section will explain what the default monitoring settings are for Web Filter, and what other options are
available.
Accessing the Monitor Settings
1 To access the Monitor Settings, select: Start > All Programs > SurfControl Web Filter >
SurfControl Web Filter Manager.
2 In the Navigation tree, select Monitored Data for your Web Filter collector or database.
3 In the Information panel, click Monitor Settings from the Monitored Data Tasks panel.
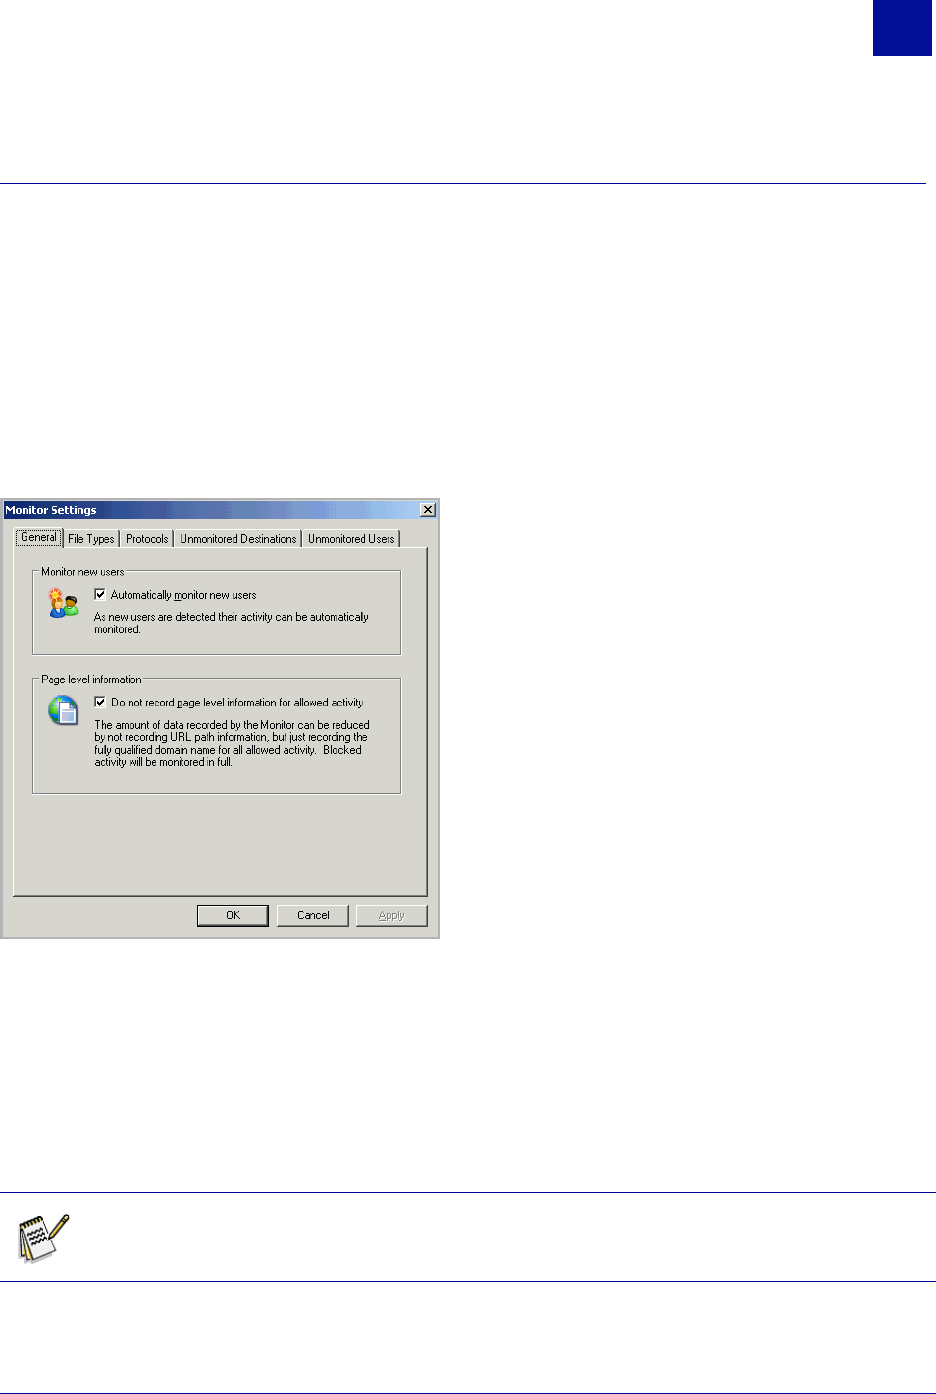
Figure 2-3 Monitor Settings dialog box
THE DEFAULT MONITOR SETTINGS
Web Filter’s default settings enable you to start monitoring users and their Internet connections
immediately. You can see the Internet traffic generated by your users as it happens by opening the Real-
Time Monitor from the Web Filter Manager > Content Protection menu, or from the Start > All
Programs > SurfControl Web Filter menu. This traffic is then saved to your database, where it can be
viewed in the Monitored Data window, and can also be used by SurfControl Report Central for
generating reports. The Monitor Settings allow you to control what activity is saved to the database.
Note: Any change made to the Monitored Data settings only affects data from that point
onwards. It does not affect historic data.
