


4-182 Series 90-30/20/Micro Programmable Controllers Reference Manual – September 1998 GFK-0467K
4
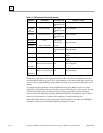
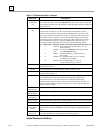
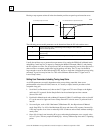
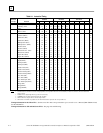
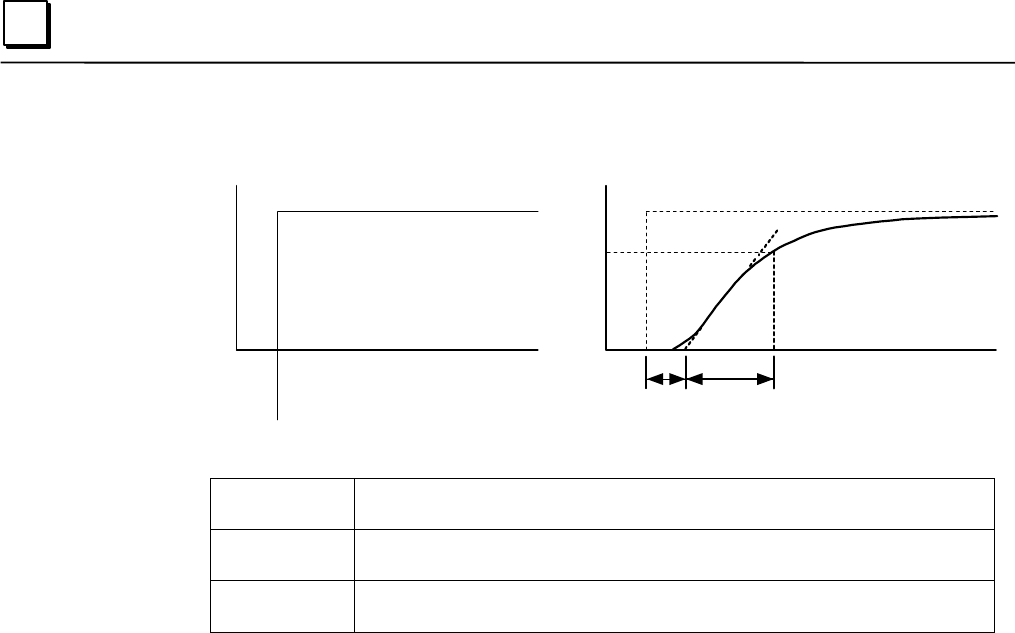
Plotting a step response at time t0 in the time domain provides an open loop unit reaction curve:
t0
Tc
K
0.632K
1
a45709
Tp
t0
CV Unit Step Output to Process
PV Unit Reaction Curve Input from Process
The following process model parameters can be determined from the PV unit reaction curve:
K Process open loop gain = final change in PV/change in CV at time t0
(Note no subscript on K)
Tp Process or pipeline time delay or dead time after t0 before the process output PV
starts moving
Tc First order Process time constant, time required after Tp for PV to reach 63.2% of the
final PV
Usually the quickest way to measure these parameters is by putting the PID block in Manual mode
and making a small step in CV output, by changing the Manual Command %Ref+13, and plotting
the PV response over time. For slow processes, this can be done manually, but for faster processes a
chart recorder or computer graphic data logging package will help. The CV step size should be
large enough to cause an observable change in PV, but not so large that it disrupts the process being
measured. A good size may be from 2 to 10% of the difference between the CV Upper and CV
Lower Clamp values .
Setting User Parameters Including Tuning Loop Gains
As all PID parameters are totally dependent on the process being controlled, there are no
predetermined values that will work, however, it is usually a simple, iterative procedure to find
acceptable loop gain.
1. Set all the User Parameters to 0, then set the CV Upper and CV Lower Clamps to the highest
and lowest CV expected. Set the Sample Period to the estimated process time constant
(above)/10 to 100.
2. Put block in Manual mode and set Manual Command (%Ref+13) at different values to check if
CV can be moved to Upper and Lower Clamp. Record PV value at some CV point and load it
into SP.
3. Set a small gain, such as 100 * Maximum CV/Maximum PV, into Kp and turn off Manual
mode. Step SP by 2 to 10% of the Maximum PV range and observe PV response. Increase Kp
if PV step response is too slow or reduce Kp if PV overshoots and oscillates without reaching a
steady value.
4. Once a Kp is found, start increasing Ki to get overshooting that dampens out to a steady value
in 2 to 3 cycles. This may required reducing Kp. Also try different step sizes and CV operating
points.