


EXCEL 10 W7761A INPUT/OUTPUT DEVICE
73 74-2699
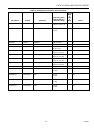
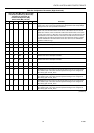
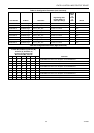
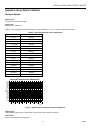
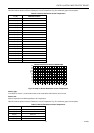
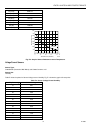
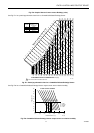
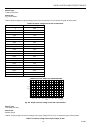
Table E-2 lists the points for Sensor Resistance versus Temperature. Fig. E-2 shows the graph of these points.
Table E-2. Sensor Resistance Versus Temperature.
°F (°C) Resistance Ohms
30 (-1.1) 1956.79
35 (1.7) 1935.79
40 (4.4) 1914.79
45 (7.2) 1893.79
50 (10) 1872.79
55 (12.8) 1851.79
60 (15.6) 1830.79
65 (18.3) 1809.79
70 (21.1) 1788.79
75 (23.9) 1767.79
80 (26.7) 1746.79
85 (29.4) 1725.79
90 (32.2) 1704.78
95 (35) 1683.78
100 (37.8) 1662.78
105 (40.6) 1641.78
110 (43.3) 1620.78
115 (46.1) 1599.78
120 (48.9) 1578.78
1650
1600
1550
1500
1700
1750
1800
1850
1900
1950
2000
555045403530 60 65 70 75 80 85 90 95100 105110115120
OHMS
°F
SENSOR RESISTANCE VERSUS TEMPERATURE
M11960
23.9
21.1
18.3
15.6
12.8
10
7.2
4.4
1.7
-1.1 26.7
29.4
32.2
35 40.6 46.1
37.8
43.3
48.9
°C
Fig. E-2. Graph of Sensor Resistance versus Temperature.
Sensor Type:
T7770A,B,C,D sensor—(current feature that can be used with the RIO Device) and C7770A.
Sensor Use:
Space Temperature and Discharge/Return Air Temperature.
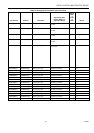
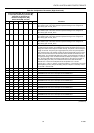
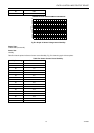
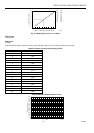
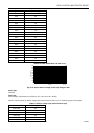
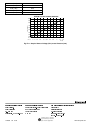
Table E-3 lists the points for Sensor Resistance versus Temperature. Fig. E-3 shows the graph of these points.
Table E-3 Sensor Resistance Versus Temperature.
°F (°C) Resistance Ohms
40 (4.4) 9961.09
45 (7.2) 9700.90
50 (10) 9440.72
55 (12.8) 9180.53
60 (15.6) 8920.35