


212 Template Reference
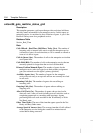
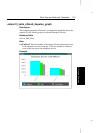
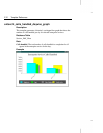
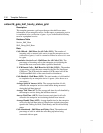
entsvc14_calls_handled_daywise_graph
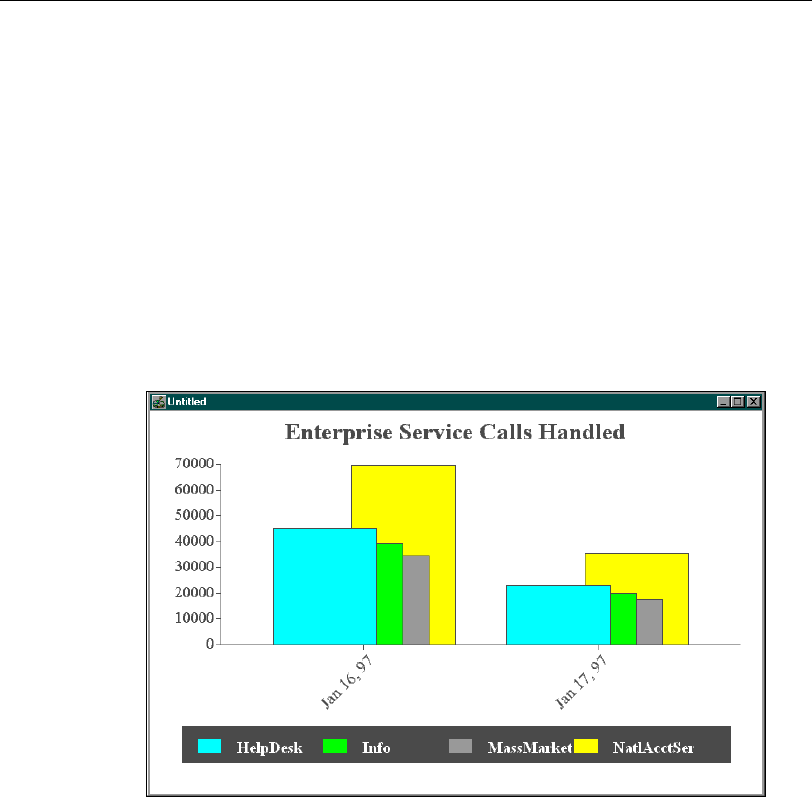
Description
This template generates a historical, overlapped bar graph that shows the
number of calls handled per day for selected enterprise services.
Database Table
Service_Half_Hour
Data
Calls handled. The total number of calls handled to completion for all
agents in the enterprise service for the day.
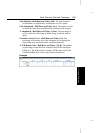
Example