


Setting Thresholds 61
3. Creating a Report
3.8. Opening the Report
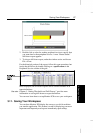
You can open the TUTOR.CMB report by selecting the Open command
from the File menu or by clicking the Open button.
À To open the TUTOR.CMB report:
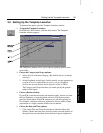
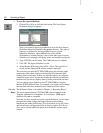
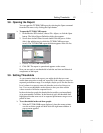
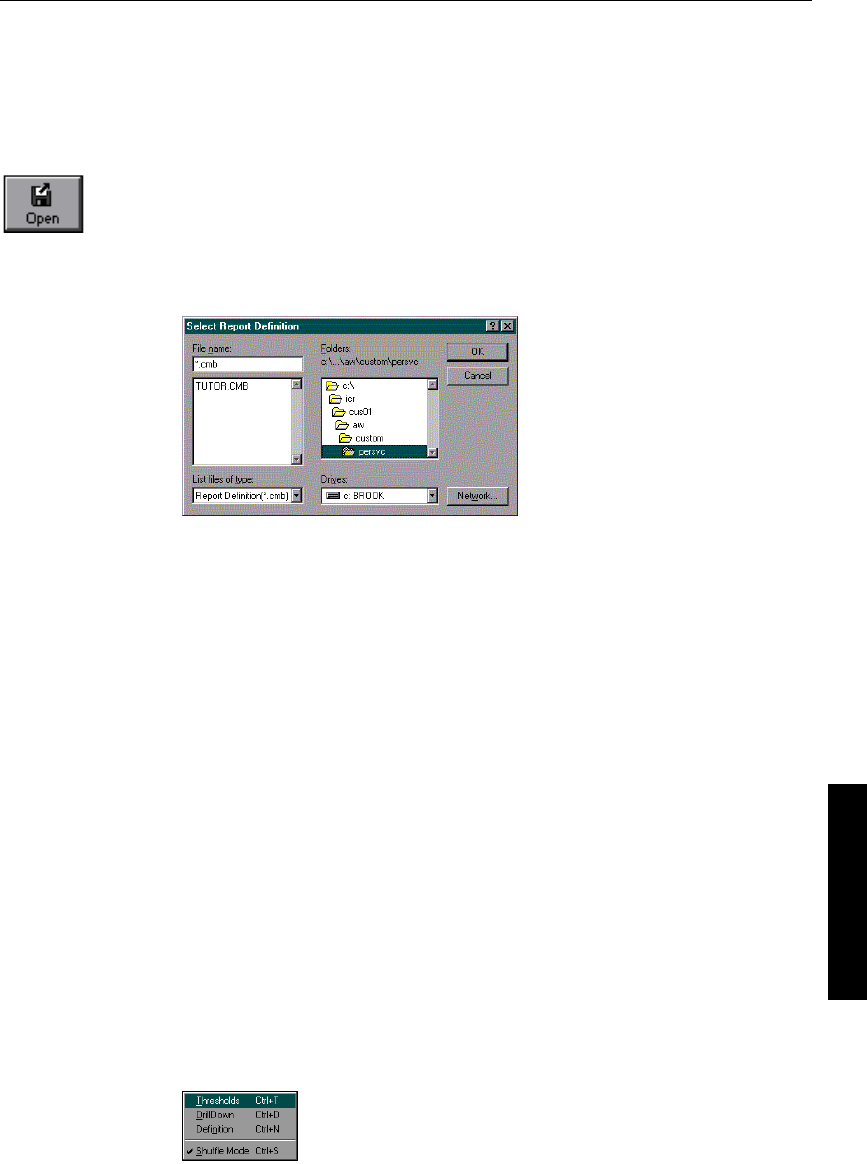
1. In the Monitor ICR window, choose File→Open, or click the Open
button. The Select Report Definition dialog box appears.
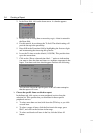
2. Scroll down in the Folders list and double-click the persvc folder
(this is the subdirectory in which the TUTOR.CMB report was
saved). The TUTOR.CMB report definition appears in the file list:
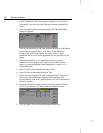
3. Choose TUTOR.CMB from the list.
4. Click OK. The report is opened and appears on the screen.
Now you are ready to set thresholds in both the real-time and historical
components of the report.
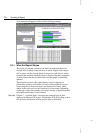
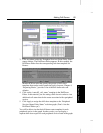
3.9. Setting Thresholds
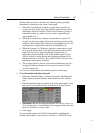
As you examine data in the report, you might decide that you want
certain data categories to stand out, especially if the values are out of an
expected performance range. For example, maybe you’d like the Service
Level column in a report to turn red when the service level drops too
low. You can set thresholds such as these to alert you when certain
values exceed or fall below expected levels.
In the real-time bar graph, the threshold alert notifies you immediately
of an unacceptable condition. In the historical grid, the threshold alert
highlights areas that were out of an expected performance range over a
period of time.
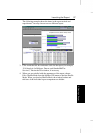
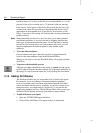
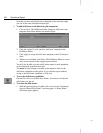
À To set thresholds in the real-time graph:
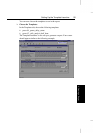
1. With the TUTOR.CMB report displayed, place the mouse pointer
over the real-time graph and hold down the right mouse button. A
pop-up menu appears: