


58 Creating a Report
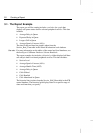
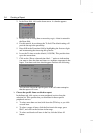
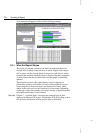
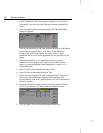
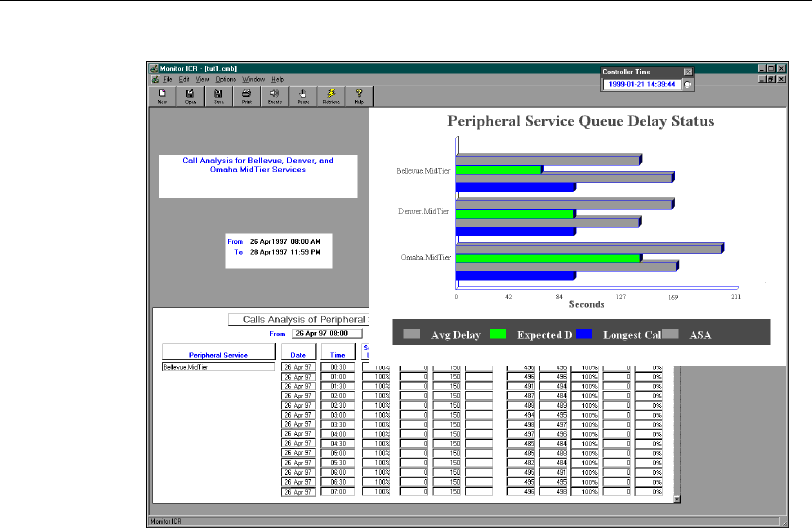
Your report should appear similar to the following example:
3.4.1. What the Report Shows
The report you created contains a real-time bar graph that shows the
average delay in queue, expected delay in queue, length of the longest
call in queue, and the average speed of answer for each service. In this
example, the real-time monitoring data is displayed for three peripheral
services. Notice that the real-time data in the bar graph is continually
updated.
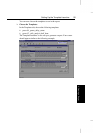
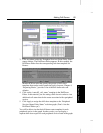
The historical section of the report displays several categories of
information related to call analysis for each of the peripheral services.
Some categories in historical reports are displayed as counts, while
others such as Service Level are displayed as a percentage. Depending
on the type of data, the summary rows total, average, or perform another
calculation on the data for each column.
See also:
Chapter 7, “Available Data,” describes the common types of data
displayed in Monitor ICR reports. The Monitor ICR on-line help system
also provides information on how specific data is calculated.