


Real-Time and Historical Templates 275
8. Template Reference
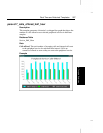
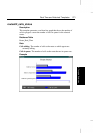
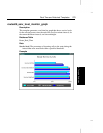
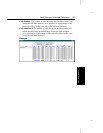
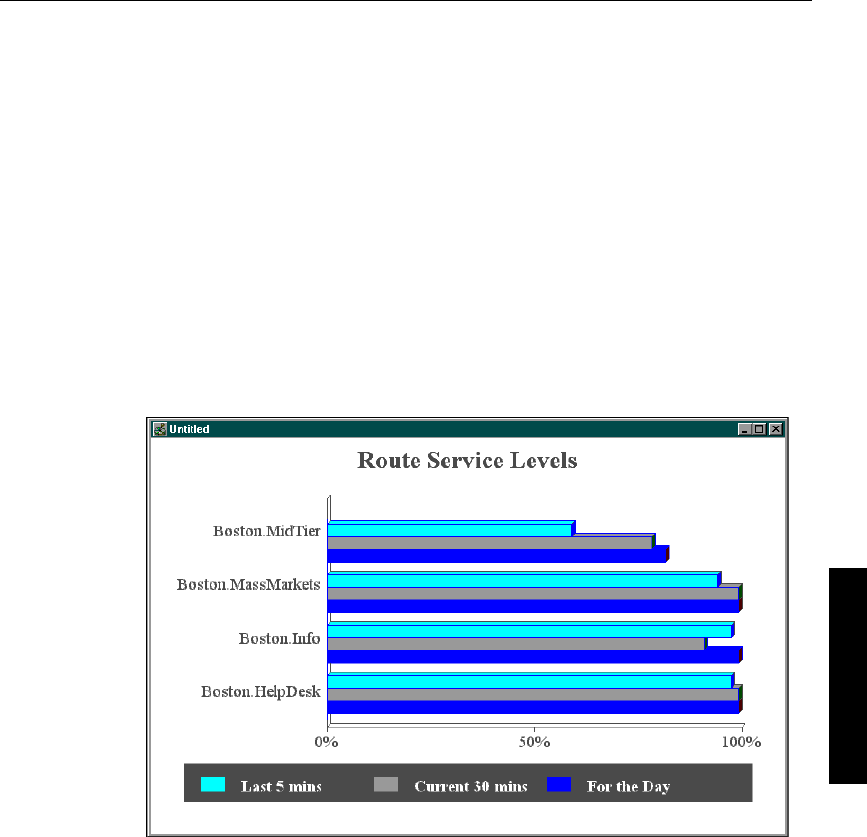
routes06_serv_level_monitor_graph
Description
This template generates a real-time bar graph that shows service levels
for the selected routes since the end of the last five-minute interval, for
the current half-hour interval, and since midnight.
Database Table
Route_Real_Time
Data
Service level. The percentage of incoming calls to the route during the
interval that were answered within a specified threshold.
Example