


Working with Reports 93
4. Reporting Basics
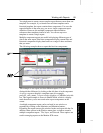
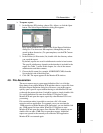
Layer. Stacks all windows within Monitor ICR on top of each other.
Cascade. Arranges all windows within Monitor ICR so that they
overlap, but each is still partially visible.
1, 2, 3.... Lets you quickly change to a different report window.
The other options of the Window menu are described in the on-line help
system.
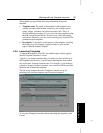
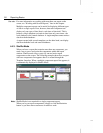
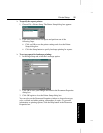
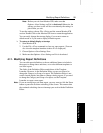
4.4.5. Status Bar
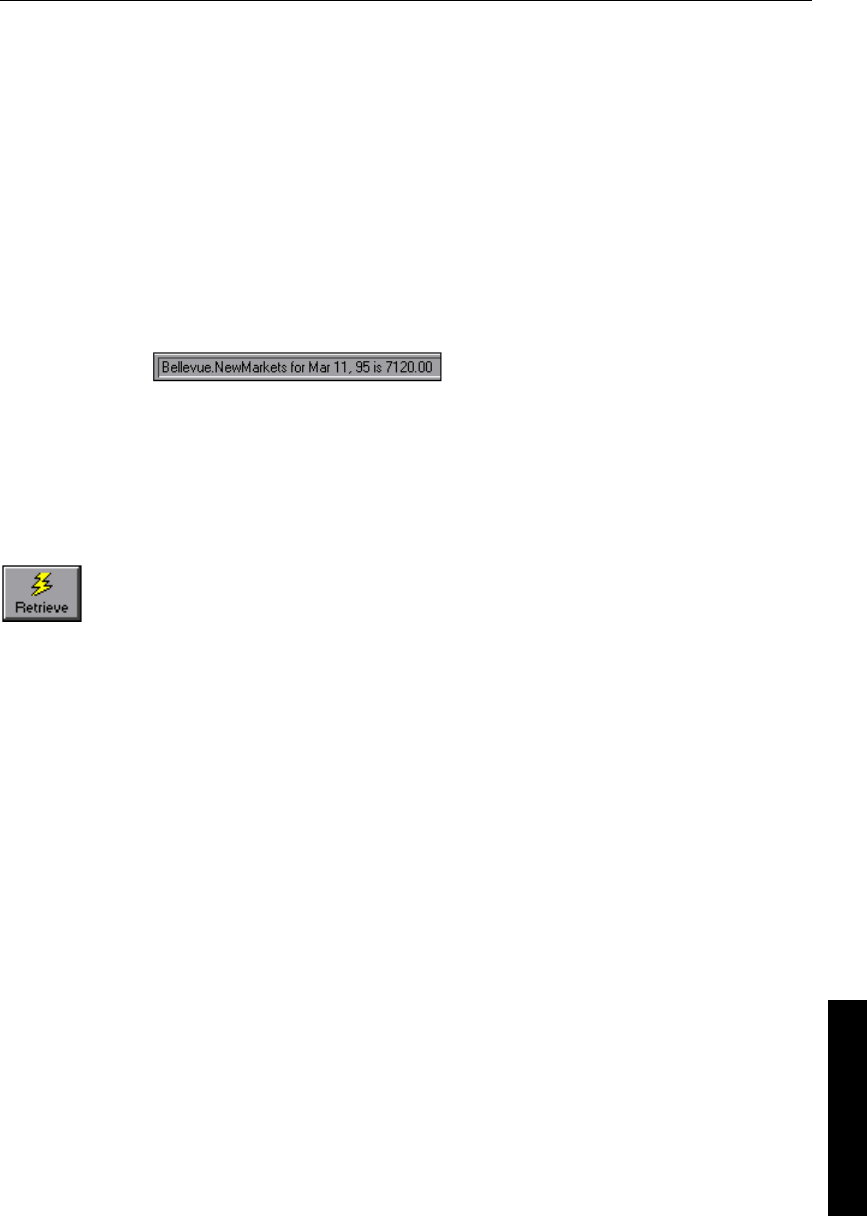
If you click on a bar in a graph style report, a message appears at the
bottom left corner of the Monitor ICR window describing what the bar
represents and its current numerical value. For example:
You can use this feature to get a precise reading of a value in the graph
or to differentiate the bars if you have trouble distinguishing their colors.
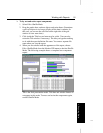
4.4.6. Retrieving Historical Data
Although Monitor ICR automatically updates real-time data while you
are viewing a report, it does not automatically update the historical
half-hour data that is displayed. While a historical report is displayed,
you can click the Retrieve button to update the report with new half-hour
data that has been collected by the ICR.
For example, if you had a historical report displayed on the screen and
you left your desk for an hour or so, you would need to click the
Retrieve button when you returned in order to display the latest
half-hour data. Monitor ICR retrieves the latest half-hour data from the
ICR central database and updates the data displayed in the report.
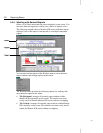
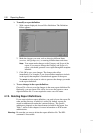
4.4.7. Pausing the Screen Refresh
You can pause the real-time refreshing of the Monitor ICR screen. The
Pause button allows you to prevent real-time reports from being
continually refreshed while you are working in Monitor ICR. This
feature is useful in several ways. For example, say you are viewing a
real-time graph and you notice that an unusual number of calls are being
offered to a particular service. You might want to “freeze” the real-time
graph in its current state in order to print it, or you might want to simply
keep the graph displayed the way it is while you further investigate the
condition.