DCP200 Profile Controller & Recorder - Product Manual
Page 42 Configuration & Use 51-52-25-150, Issue 1 – April 2009
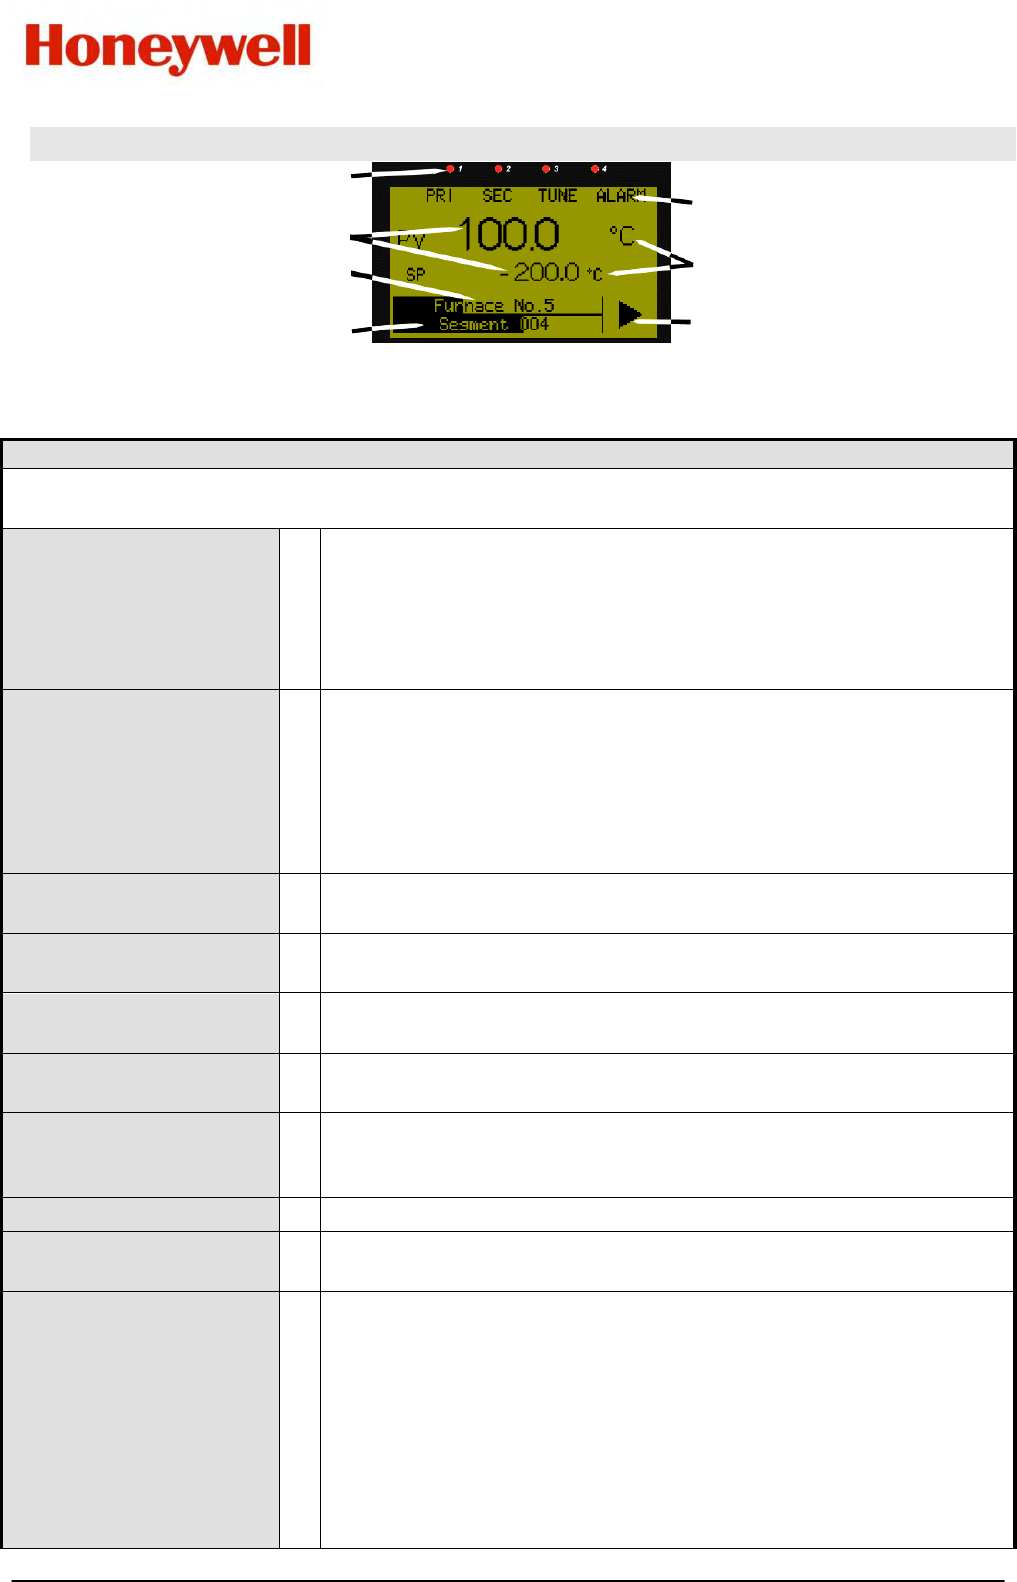
Example Profile Operating Screen
LED Indicators
LED Function Labels
Process Value & Setpoint
Engineering Units
Profile Name & Progress
Segment No. & Progress Profile Status
► Run,
▌▌
Held,
■
Stopped
Table 4. Operation Mode Screens
Operation Mode:
After 2 minutes without key activity, the most screens revert to the Base Operating Screen. Screens
marked do not revert automatically. They remain displayed until the user navigates away.
Calibration Check Due
Warning
Shown if a Calibration Reminder is set and the due date has passed-
if the feature is enabled in Control Configuration. Recorder version
only.
Shown at power up (and repeated once per day).
Press to acknowledge and continue using the instrument.
Re-calibrate or disable the reminder to cancel the warning.
Base Operating Screen.
Displayed is:
LED Labels; PV value;
SP value & Bar Graph
LED Labels = LED indicator functions. Defaults are HEAT, COOL,
TUNE & ALARM - can be altered with configuration software
PV value = The current Process Variable value.
SP value = The current Setpoint value.
Bar Graph = Primary/Secondary Power; Deviation or Memory Use. -
see Bar Graph Format screen in Display Configuration.
Auto/Manual Control
Mode Selection
Allows switching between automatic and manual control modes.
– only shown if enabled in Control Configuration.
Setpoint Value Display
& Adjustment
View and alter local (internal) setpoint(s) to any value between the
Setpoint Upper and Lower Limits. Remote setpoints are read only.
Setpoint Ramp Rate
Setpoint Ramp Rate adjustment between 0.1 and 9999.0 Display
Units per hour. - only shown if enabled in Control Configuration.
Select Setpoint Source
Select if Local Setpoint 1 or the Alternate Setpoint is to be the active
setpoint. - only shown if enabled in Control Configuration.
Control Enable
Enables or disables control outputs. When disabled, the unit works
normally except the Primary and Secondary Control Outputs are
turned off - only shown if enabled in Control Configuration.
Alarm Status
Shows the status (Active, Inactive or Unused) of the five alarms.
Event Status Shows the status (Active or Inactive) of the five Events - Profiler
version only.
Profiler Operating
Screen
Displayed is:
LED Labels; PV value;
SP value; Bar Graph &
Status Indicator
LED Labels = LED indicator functions. Defaults are HEAT, COOL,
TUNE & ALARM - can be altered with configuration software
PV value = The current Process Variable value.
SP value = The current Setpoint value.
Bar Graph = The Profile Name & overall progress; the current
Segment Number and segment progress
Status Indicator =
►
(Run),
▌▌
(Held), or
■
(Stopped).
- Profiler version only.


