


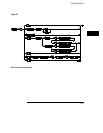

Introduction
The State Chart subsystem provides the commands necessary for
programming the Chart display of 1660A-series logic analyzers. The
commands allow you to build charts of label activity, using data
normally found in the Listing display. The chart’s Y-axis is used to
show data values for the label of your choice. The X-axis can be used
in two different ways. In one, the X-axis represents states (shown as
rows in the State Listing display). In the other, the X-axis represents
the data values for another label. When states are plotted along the
X-axis, X and O markers are available. Because the State Chart
display is simply an alternative way of looking at the data in the State
Listing, the X and O markers can be manipulated through the SLISt
subsystem. Because the programming commands do not force the
menus to switch, you can position the markers in the SLISt subsystem
and see the effects in the State Chart display.
The commands in the SCHart subsystem are:
•
ACCumulate
•
HAXis
•
VAXis
19–2