


101
A/C-7P RO, A/C-7S RO
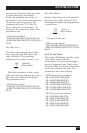
Comments—¬GX<'text'>
Allows text to be added to IOGL
commands for documentation.
Comments will not print out.
For example: ¬GX’Pie chart with 3
elements’ can be used to document
an IOGL pie chart command.
6.7 I-O Graphics Language™ (IOGL)
in Action
6.7.1 G
ENERAL
S
TEPS
I-O Graphics Language™ (IOGL)
can be used in many different ways.
It can enhance the appearance of
standard host reports through a few
simple graphical elements such as
lines, boxes, and circles; or it can be
used to present pertinent data
through charts. IOGL can even be
used to create sophisticated
electronic forms. However,
programming with IOGL always
follows the same general steps:
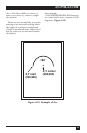
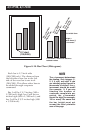
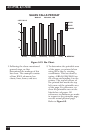
1.Determine which IOGL
elements are needed to create
the desired output (the bar chart
shown below uses four different
IOGL elements.)
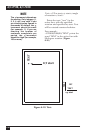
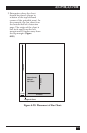
2.Determine the printable area of
the page.
3.Determine the positioning of the
graphical elements relative to
the top left-hand corner of the
printable area.
4.PCL color printer only:
Determine the order in which to
print the graphical elements.
The lines of the last IOGL
element will overlap (and cover)
the previous IOGL elements.
5.Design the graphical output, one
element at a time.
6.Link the graphical output with
your host application.
6.7.2 T
UTORIAL
The following example (Figure
6-19) shows how multiple IOGL
elements interact to create a bar
chart.