


94
A/C-7P RO, A/C-7S RO
Color/Shading—¬GS<# of
values>;<color 1>;<% shading
1>;<color 2>;<% shading 2>;...
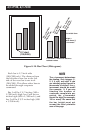
Defines the color and shading of
the pie-chart and bar-chart
segments. The first value entered in
the pie and bar chart commands will
be printed in color 1 with shading 1.
The second value entered in the pie
and bar chart commands will be
printed in color 2 with shading 2.
Colors are entered as numeric
values 0-16 (corresponding to color
command scheme). Shading is
entered as a numeric value from 0-
100 (% of shading). If the attached
printer is not capable of recognizing
PCL color commands, all printing
will be black. Refer to pie and bar
charts for an example.
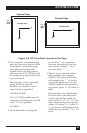
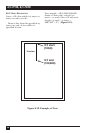
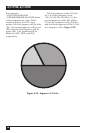
Pie Chart—¬GP<line width>; <x
center>;<y center>;<radius>;<#
of segments>;<segment value
1>;<segment value 2>;....
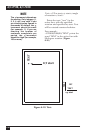
Draws a pie chart around the xy
center with the specified radius (in
n/300 inches), number of segments
(maximum of 9), and segment
values. Segment values are entered
as numerics and converted to
percentages. Segment values can
range from 0 to 100.
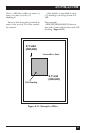
Each segment will have the color
and/or shading as specified in the
shading command (pie chart value 1
will get color/shading value 1,...).
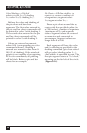
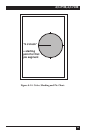
<line width> is specified in mm. The
first pie segment starts at “9 o’clock,”
meaning on the far left of the circle
(Figure 6-14).