


97
A/C-7P RO, A/C-7S RO
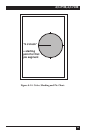
Bar Chart (Histogram)—¬GH<line
width>;<x start>;<y start>;<x
increment>;<y increment>;<bar
width>;<# of entries>; <value
1>;<value 2>; ...
Draws a bar chart. xy start specifies
the bottom left hand corner of the
first bar (the origin on the chart’s xy
scale). The x increment specifies the
horizontal movement before the
next bar is printed. The y increment
(in n/300 inches) determines the
height of the bar (multiplied by the
value). The bar width (in n/300
inches) specifies the width of the
bar. Bar chart values can range from
0 to 3,000. Each bar will have the
color and/or shading as specified in
the shading command (bar 1 is
color/shading value 1,...). A
maximum of 12 bars can be printed.
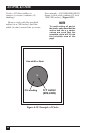
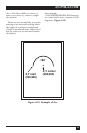
For example:
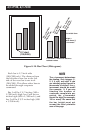
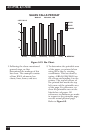
¬GS3;01;20;02;50;04;80
¬GH1;100;2400;300;1;100;3;500;600;
800 draws three bars. If the attached
printer is a PCL color printer, the
first bar will be blue, the second red,
and the third green. The bars will be
shaded 20%, 50%, and 80%
respectively (Figure 6-16).