


98
A/C-7P RO, A/C-7S RO
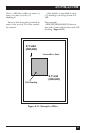
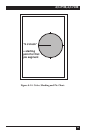
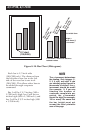
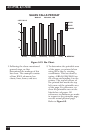
Figure 6-16. Bar Chart (Histogram).
NOTE
The y-increment determines
the scaling. Only integers (1,
2, 3, 4, etc.) are valid. If you
are charting sales figures in
thousands of dollars, the y-
increment should be small
(for example, 1). If you are
charting the number of
customer complaints per
period, the y-increment
should be high (for example,
100 or more). Be aware that
the bar height must not
exceed the total printable
area of the page.
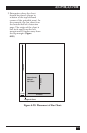
X,Y start
(100,2400)
x increment = horizontal distance
between values
Height =
value times (*)
y increment
Line width 5mm
Bar 1 (value 500)
Color: Blue*
Shading: 20%
Bar 1 (value 500)
Color: Red*
Shading: 50%
Bar 1 (value 500)
Color: Green*
Shading: 80%
Each bar is 1/3 inch wide
(100/300 inch). The distance from
the left side of one bar to the left
side of the next bar is one inch
(300/300). This allows other bars to
be added through a separate
command.
Bar 1 will be 1 2/3 inches (500 x
1/300 inch) high, bar 2 will be two
inches high (600 x 1/300 inch), and
bar 3 will be 2 2/3 inches high (800
x 1/300 inch).