


Adjusting the EQ
VM200 User’s Guide
55
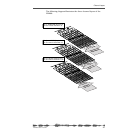
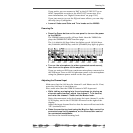
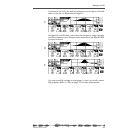
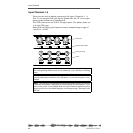
If you lower the Freq, the soft bell-shaped curve in Figure B would
move to the left, as illustrated in Figure C:
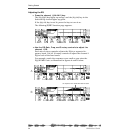
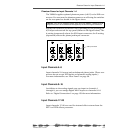
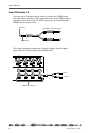
In Figures D and E below, notice how the frequency range changes
and the response curve sharpens and narrows as the EQ/HI-MID
Q value is raised.
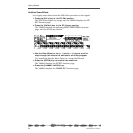
You can store EQ settings in a program, or you can recall a preset
EQ program. Refer to “EQ” on page 75 for more information.
C
D
E