


Example: Using the Matrix Referral method
This example illustrates setting up a matrix to measure four related process fluids.
Viscosity data
For each process fluid, dynamic viscosity data was collected for temperatures ranging from
250 °F to 350 °F. Multiple samples were taken at each temperature, and averaged.
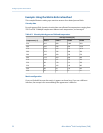
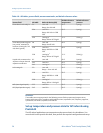
Viscosity data by process fluid and temperatureTable 4-5:
Temperature (°F)
Average viscosity (cP)
Fluid 1 Fluid 2 Fluid 3 Fluid 4
250 615 860 1446 2321
260 435 595 924 1526
270 329 443 674 1076
280 253 336 499 780
290 196 260 379 576
300 154 203 292 430
310 123 161 228 330
320 99 129 181 258
330 81 105 146 203
340 68 85 118 162
350 56 70 97 131
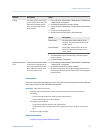
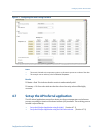
Matrix configuration
If you use ProLink III to enter the matrix, it appears as shown here. If you use a different
interface, the concept is the same although the appearance is different.
Configure process measurement
52 Micro Motion
®
Fork Viscosity Meters (FVM)