C H A P T E R 7 Monitoring
7-13
Monitoring
Monitoring Reports
A monitoring report is one line of user-configurable text displayed at
the console at a user-configurable interval of between five and 65000
seconds. The interval default is 15 seconds.Console Configuration
Monitoring reports are disabled by default, and are enabled with the
CLI monitor... command set. The monitoring application is aware of
the port on which the enable command arrives, and accordingly sends
reports to that same port, thus monitoring reports are displayed on the
same console from which the feature is enabled.
Report Configuration
You can specify the fields to be displayed in each report. Reports
begin with the letter “M” (for monitor report, to distinguish them
from alarm reports) and the timestamp. The other fields available are
user-selectable via a CLI command see “CLI Commands” this below
in this section). The standard default fields are mode, failmode, CPU,
SSLCS, and OVR. Monitor reports are disabled by default.
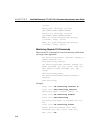
Monitor report format:
M:yyyymmddhhmmss:mode:failmode:CPU;i,k,a:SSL
CS;c,m,t:OVR;r,c,m,t:
NetIF;s:SvrIF;s:BES;c,m,t;BDS;c,m,t
Where:
M Monitor report
yyyymmddhhmmss Timestamp
mode Bypass mode status [INLINE|BYPASS]
failmode Fail mode status [SAFE|THRU]
CPU;i,k,a CPU%; (i)dle, (k)ernel,
(a)pplication
SSLCS;c,m,t SSL Connections per Second;
(c)urrent, (m)ax, (t)otal
OVR;r,c,m,t Overload events; (r)esponse
[SPIL|THRT], (c)urrent, (m)ax,


