


141
Chapter 4: Using the Logic Analyzer in Eye Scan Mode
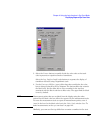
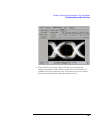
Displaying Captured Eye Scan Data
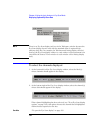
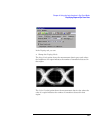
3. Select the Linear button to equally divide the color scale so that each
color represents an equal increment of transitions.
Select the Log, Log2, or Log10 scale buttons to separate the display of
transitions detected using a logarithmic scale.
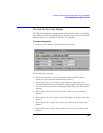
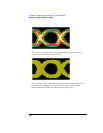
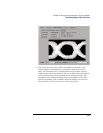
4. Use the Parts per Million (ppm) slider bars above and below the color
bars to bring out detail in the eye diagram. The bottom slider bar controls
the black level. Set the slider bar or enter a number in the text box
associated with the black color bar to hide noise. The upper limit for black
is zero by default.
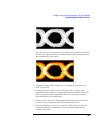
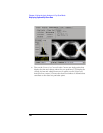
NOTE: Measurement points that are excluded from the display using the value
entered for the black color bar will not be reported by the measurement tools.
To cause the measurement tools to report all measurement points, enter 0
(zero) in the box for the black color bar in the Color Scale window. See “To
make measurements on the eye scan data” on page 142.
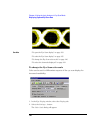
Similarly, you can use the top slider bar or enter a number in the text