


260
Chapter 6: Concepts
Understanding Eye Scan Measurements
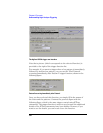
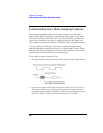
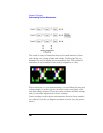
The result is a map of transitions detected in small windows of time
and voltage over a range of time and voltage. Oscilloscope-like eye
diagrams are used to display the measurement data. The number of
transitions in each window is indicated by brightness or color.
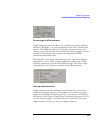
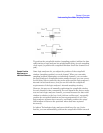
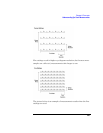
When setting up eye scan measurements, you can define the time and
voltage ranges, as well as the size (in other words, resolution) of the
time and voltage windows. There are coarse, medium, and fine settings,
and you can make adjustments to these settings.
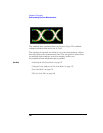
Coarse settings result in faster measurements because fewer samples
are collected, but the eye diagram resolution is lower (see the picture
above).