


97
Chapter 3: Using the Logic Analyzer in Timing or State Mode
Displaying Captured Data
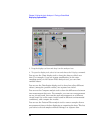
You can use the Serial Analysis toolset to convert streams of serial data
into parallel words which are easier to view and analyze.
You can use the System Performance Analysis toolset to do things like:
isolate the root cause of performance bottlenecks, measure function
execution times, view the occurrence rate of an event, analyze bus
occupation and bandwidth, analyze bus stability, analyze jitter or time
dispersion, etc.
See Also Using the Chart Display Tool (see the Chart Display Tool help volume)
Using the Distribution Display Tool (see the Distribution Display Tool
help volume)
Using the Compare Analysis Tool (see the Compare Tool help volume)
Using the Pattern Filter Analysis Tool (see the Pattern Filter Tool help
volume)
Using the Serial Analysis Tool (see the Serial Analysis Tool help volume)
Using the System Performance Analyzer (see the System Performance
Analyzer help volume)
Measurement Examples (see the Measurement Examples help volume)
If the captured data doesn't look correct
Intermittent Data
Errors
Check for poor connections, incorrect signal levels on the hardware,
incorrect logic levels under the logic analyzer's Config tab, or marginal
timing for signals.
Unwanted Triggers
If you are using an inverse assembler or a pipeline, triggers can be
caused by instructions that were fetched but not executed. To fix, add
the prefetch queue or pipeline depth to the trigger address.
The depth of the prefetch queue depends on the processor that you are
analyzing, and can be quite deep.
Another solution which is sometimes preferred with very deep prefetch
queues is to add writes to dummy variables to your software. Put the
instruction just before the area you want to trigger on, then trigger on