


96
Chapter 3: Using the Logic Analyzer in Timing or State Mode
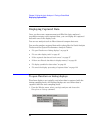
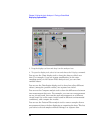
Displaying Captured Data
3. Drag the display tool icon and drop it on the analyzer icon.
4. To open the display tool, select its icon and choose the Display command.
You can use the Chart display tool to chart the data on a label over
time. For example, if you use storage qualification (in the state
sampling mode) or the Pattern Filter analysis tool, you can chart
variable values.
You can use the Distribution display tool to show how often different
values (among the possible values) are captured on a label.
You can use the Compare analysis tool to show the differences between
two measurement data sets. For example, you can run a measurement
on one circuit board, then run the same measurement on a different
circuit board (or on the same circuit board in different environmental
conditions), and compare the results.
You can use the Pattern Filter analysis tool to remove samples from a
measurement data set before displaying or exporting the data. This lets
you look at selected samples without having to re-capture data.